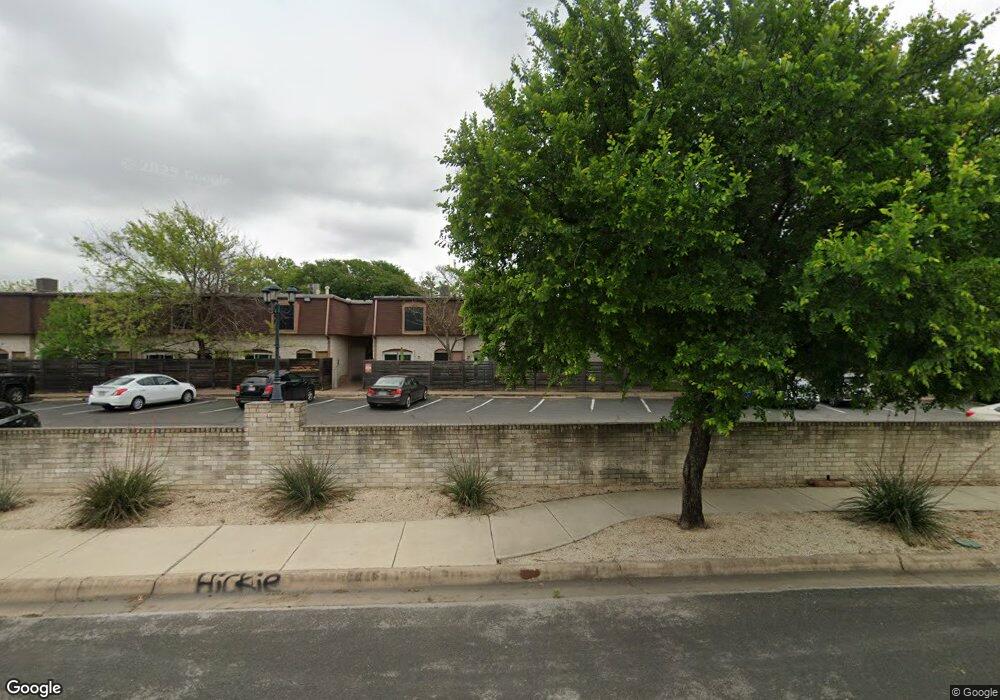
7801 Shoal Creek Blvd Unit 109 Austin, TX 78757
Allandale NeighborhoodEstimated Value: $202,000 - $314,000
--
Bed
--
Bath
940
Sq Ft
$274/Sq Ft
Est. Value
About This Home
This home is located at 7801 Shoal Creek Blvd Unit 109, Austin, TX 78757 and is currently estimated at $257,799, approximately $274 per square foot. 7801 Shoal Creek Blvd Unit 109 is a home located in Travis County with nearby schools including Gullett Elementary School, Lamar Middle School, and McCallum High School.
Ownership History
Date
Name
Owned For
Owner Type
Purchase Details
Closed on
Jun 14, 2012
Sold by
Glenn Jill Jackman
Bought by
Jackman Jill
Current Estimated Value
Home Financials for this Owner
Home Financials are based on the most recent Mortgage that was taken out on this home.
Original Mortgage
$58,050
Outstanding Balance
$8,623
Interest Rate
3.86%
Mortgage Type
New Conventional
Estimated Equity
$249,176
Purchase Details
Closed on
Mar 30, 1998
Sold by
Vandestreek Timothy Jon and Vandestreek Tammy
Bought by
Graves Stephen G
Home Financials for this Owner
Home Financials are based on the most recent Mortgage that was taken out on this home.
Original Mortgage
$57,890
Interest Rate
7.04%
Mortgage Type
FHA
Purchase Details
Closed on
Oct 14, 1994
Sold by
Wilson V Janice
Bought by
Streek Timothy Jon Vande and Streek Tammy Vande
Home Financials for this Owner
Home Financials are based on the most recent Mortgage that was taken out on this home.
Original Mortgage
$43,000
Interest Rate
8.5%
Create a Home Valuation Report for This Property
The Home Valuation Report is an in-depth analysis detailing your home's value as well as a comparison with similar homes in the area
Home Values in the Area
Average Home Value in this Area
Purchase History
| Date | Buyer | Sale Price | Title Company |
|---|---|---|---|
| Jackman Jill | -- | None Available | |
| Graves Stephen G | -- | Gracy Title | |
| Streek Timothy Jon Vande | -- | Commonwealth Title |
Source: Public Records
Mortgage History
| Date | Status | Borrower | Loan Amount |
|---|---|---|---|
| Open | Jackman Jill | $58,050 | |
| Previous Owner | Graves Stephen G | $57,890 | |
| Previous Owner | Streek Timothy Jon Vande | $43,000 | |
| Closed | Streek Timothy Jon Vande | $5,930 |
Source: Public Records
Tax History Compared to Growth
Tax History
| Year | Tax Paid | Tax Assessment Tax Assessment Total Assessment is a certain percentage of the fair market value that is determined by local assessors to be the total taxable value of land and additions on the property. | Land | Improvement |
|---|---|---|---|---|
| 2025 | $1,966 | $239,565 | $98,450 | $141,115 |
| 2023 | $3,037 | $238,017 | $0 | $0 |
| 2022 | $4,273 | $216,379 | $0 | $0 |
| 2021 | $4,282 | $196,708 | $0 | $0 |
| 2020 | $3,836 | $178,825 | $49,225 | $162,927 |
| 2018 | $3,272 | $147,789 | $49,225 | $161,937 |
| 2017 | $2,996 | $134,354 | $25,597 | $175,308 |
| 2016 | $2,724 | $122,140 | $25,597 | $130,738 |
| 2015 | $2,097 | $111,036 | $25,597 | $129,654 |
| 2014 | $2,097 | $100,942 | $25,597 | $75,345 |
Source: Public Records
Map
Nearby Homes
- 7801 Shoal Creek Blvd Unit 224
- 7801 Shoal Creek Blvd Unit 240
- 3202 Whiteway Dr
- 3307 Whitepine Dr
- 3103 Whiteway Dr
- 7920 Rockwood Ln Unit 240
- 7920 Rockwood Ln Unit 115
- 3206 Silverleaf Dr
- 2805 Silverway Dr
- 3103 Skylark Dr
- 3205 Skylark Dr
- 3305 Skylark Dr
- 8018 Rockwood Ln
- 7685 Northcross Dr Unit 729
- 7685 Northcross Dr Unit 1028
- 7685 Northcross Dr Unit 329
- 7685 Northcross Dr Unit 1024
- 7685 Northcross Dr Unit 524
- 7685 Northcross Dr Unit 200
- 2713 Cascade Dr
- 7801 Shoal Creek Blvd Unit 213
- 7801 Shoal Creek Blvd Unit 113
- 7801 Shoal Creek Blvd Unit 112
- 7801 Shoal Creek Blvd Unit 111
- 7801 Shoal Creek Blvd Unit 110
- 7801 Shoal Creek Blvd Unit 108
- 7801 Shoal Creek Blvd Unit 204
- 7801 Shoal Creek Blvd Unit 203
- 7801 Shoal Creek Blvd Unit 107
- 7801 Shoal Creek Blvd Unit 106
- 7801 Shoal Creek Blvd Unit 105
- 7801 Shoal Creek Blvd Unit 104
- 7801 Shoal Creek Blvd Unit 103
- 7801 Shoal Creek Blvd Unit 202
- 7801 Shoal Creek Blvd Unit 201
- 7801 Shoal Creek Blvd Unit 102
- 7801 Shoal Creek Blvd Unit 101
- 7801 Shoal Creek Blvd Unit 118
- 7801 Shoal Creek Blvd Unit 117
- 7801 Shoal Creek Blvd Unit 116