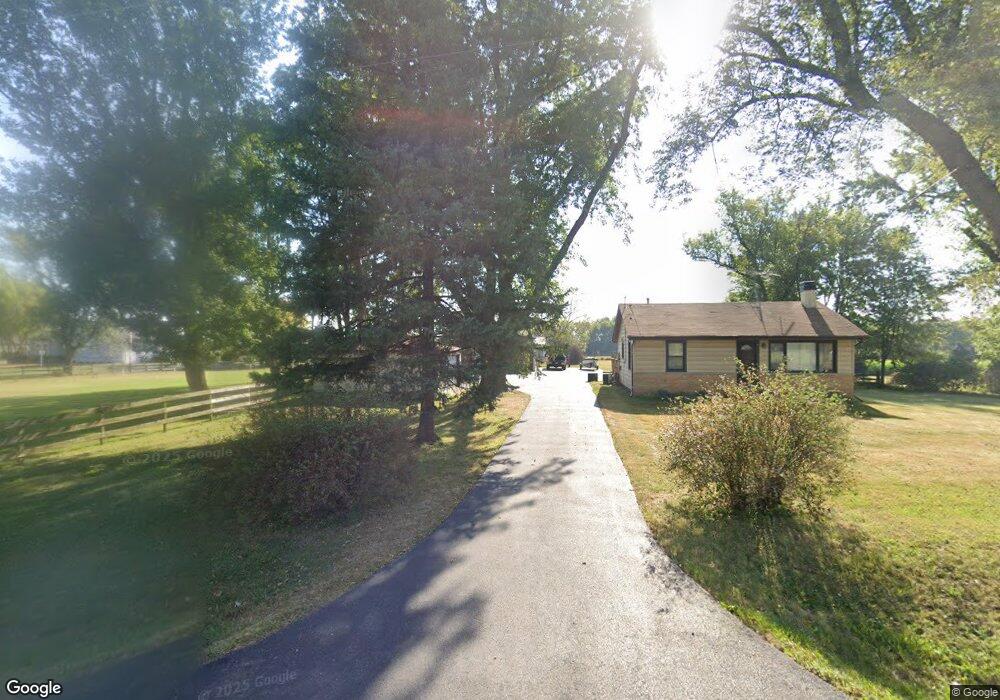
7804 Wilmot Rd Spring Grove, IL 60081
Northwest Fox Lake NeighborhoodEstimated Value: $267,000 - $413,000
2
Beds
1
Bath
837
Sq Ft
$391/Sq Ft
Est. Value
About This Home
This home is located at 7804 Wilmot Rd, Spring Grove, IL 60081 and is currently estimated at $327,598, approximately $391 per square foot. 7804 Wilmot Rd is a home located in McHenry County with nearby schools including Spring Grove Elementary School, Nippersink Middle School, and Richmond-Burton High School.
Ownership History
Date
Name
Owned For
Owner Type
Purchase Details
Closed on
Jun 19, 2012
Sold by
Battisfore Karen Francine
Bought by
Cramond Harry and Cramond Yvonne E
Current Estimated Value
Home Financials for this Owner
Home Financials are based on the most recent Mortgage that was taken out on this home.
Original Mortgage
$73,500
Interest Rate
3.83%
Mortgage Type
New Conventional
Purchase Details
Closed on
Aug 8, 2011
Sold by
Coates Lucretia J
Bought by
Coates Lucretia Jane
Purchase Details
Closed on
May 16, 2011
Sold by
Vandenbroek Erik A and Vandenbroek Elizabeth
Bought by
Coates Lucretia J
Purchase Details
Closed on
May 13, 2003
Sold by
Mehner Alice P
Bought by
Vandenbroek Erik A
Home Financials for this Owner
Home Financials are based on the most recent Mortgage that was taken out on this home.
Original Mortgage
$154,000
Interest Rate
5.87%
Mortgage Type
Purchase Money Mortgage
Create a Home Valuation Report for This Property
The Home Valuation Report is an in-depth analysis detailing your home's value as well as a comparison with similar homes in the area
Home Values in the Area
Average Home Value in this Area
Purchase History
| Date | Buyer | Sale Price | Title Company |
|---|---|---|---|
| Cramond Harry | $168,500 | First American Title | |
| Coates Lucretia Jane | -- | First American Title | |
| Coates Lucretia J | $185,000 | Chicago Title | |
| Vandenbroek Erik A | $194,000 | Multiple |
Source: Public Records
Mortgage History
| Date | Status | Borrower | Loan Amount |
|---|---|---|---|
| Closed | Cramond Harry | $73,500 | |
| Previous Owner | Vandenbroek Erik A | $154,000 |
Source: Public Records
Tax History Compared to Growth
Tax History
| Year | Tax Paid | Tax Assessment Tax Assessment Total Assessment is a certain percentage of the fair market value that is determined by local assessors to be the total taxable value of land and additions on the property. | Land | Improvement |
|---|---|---|---|---|
| 2024 | $6,762 | $90,029 | $26,340 | $63,689 |
| 2023 | $6,748 | $83,966 | $24,566 | $59,400 |
| 2022 | $6,289 | $73,862 | $21,610 | $52,252 |
| 2021 | $5,997 | $69,628 | $20,371 | $49,257 |
| 2020 | $5,880 | $66,559 | $19,473 | $47,086 |
| 2019 | $5,923 | $65,524 | $19,170 | $46,354 |
| 2018 | $6,056 | $63,498 | $18,577 | $44,921 |
| 2017 | $5,998 | $59,628 | $17,445 | $42,183 |
| 2016 | $6,042 | $56,946 | $16,660 | $40,286 |
| 2013 | -- | $59,395 | $16,450 | $42,945 |
Source: Public Records
Map
Nearby Homes
- Lot 64 Beverly Way
- Lot 61 Beverly Way
- Lot 60 Beverly Way
- Lot 59 Beverly Way
- Lot 58 Beverly Way
- Lot 57 Beverly Way
- 7710 Ravina Dr
- LOT 56 Beverly Way
- Lot 65 & 66 Main Street Rd
- 1410 Linden Rd
- 8303 Appaloosa Ln
- 8300 Appaloosa Ln
- 7503 Windsor Ave
- 8407 Appaloosa Ln
- 8501 Country Shire Ln
- 7075 Hidden Green Cir
- 8610 Steeple Ln
- 535 Deer Run
- LOT 9 Mayo Ct
- 7830 N Pillow Hill Rd
- 7802 Wilmot Rd
- 7646 Wilmot Rd
- 912 Main Street Rd
- 1012 Main Street Rd
- 1206 Main Street Rd
- 1202 Main Street Rd
- 1103 Main Street Rd
- 8053 Wilmot Rd
- 1208 Main Street Rd
- 1115 Main Street Rd
- 7615 Wilmot Rd
- 1210 Main Street Rd
- 818 Main Street Rd
- 1007 Main Street Rd
- 7708 Arlington Ln
- 1003 Main Street Rd
- 1102 Melbourne Place
- 1104 Melbourne Place
- 7709 Arlington Ln
- 7704 Arlington Ln