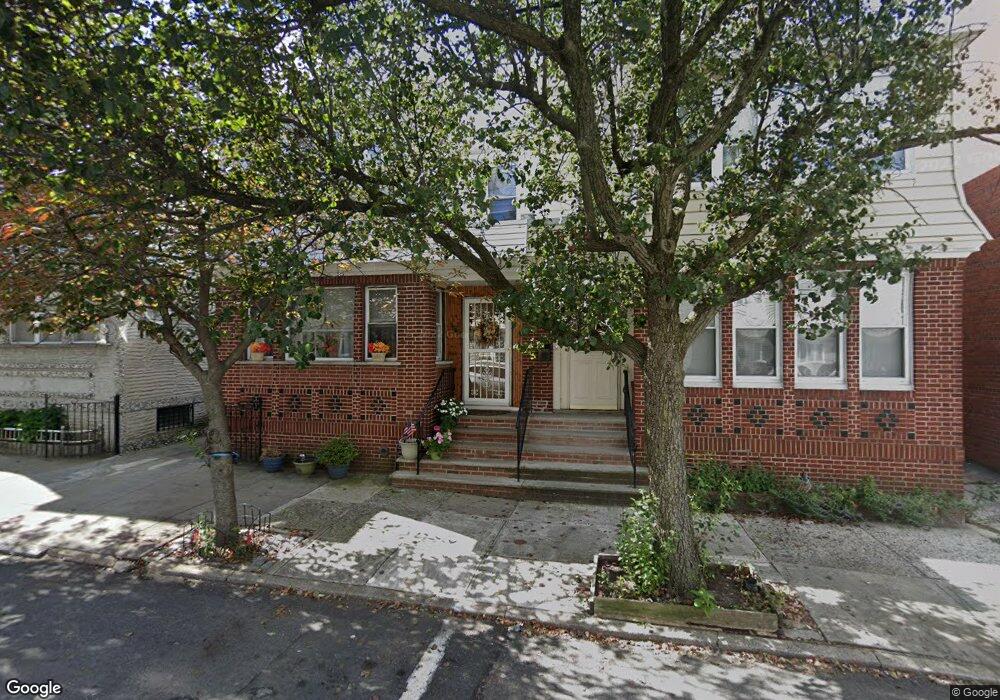
7808 83rd St Glendale, NY 11385
Glendale NeighborhoodEstimated Value: $949,456 - $1,170,000
--
Bed
--
Bath
2,420
Sq Ft
$454/Sq Ft
Est. Value
About This Home
This home is located at 7808 83rd St, Glendale, NY 11385 and is currently estimated at $1,099,364, approximately $454 per square foot. 7808 83rd St is a home located in Queens County with nearby schools including P.S./I.S. 113 Anthony J. Pranzo School, Queens Metropolitan High School, and Elm Community Charter School.
Ownership History
Date
Name
Owned For
Owner Type
Purchase Details
Closed on
Feb 3, 1998
Sold by
Martino Tommaso and Martino Olivia
Bought by
Mccleary Lawrence S and Mcclearly Tara
Current Estimated Value
Home Financials for this Owner
Home Financials are based on the most recent Mortgage that was taken out on this home.
Original Mortgage
$224,000
Outstanding Balance
$39,408
Interest Rate
6.93%
Estimated Equity
$1,059,956
Purchase Details
Closed on
Dec 30, 1996
Sold by
Maniscalchi Mariano and Maniscalchi Vita
Bought by
Martino Tommaso and Martino Olivia
Create a Home Valuation Report for This Property
The Home Valuation Report is an in-depth analysis detailing your home's value as well as a comparison with similar homes in the area
Home Values in the Area
Average Home Value in this Area
Purchase History
| Date | Buyer | Sale Price | Title Company |
|---|---|---|---|
| Mccleary Lawrence S | $280,000 | -- | |
| Martino Tommaso | -- | -- |
Source: Public Records
Mortgage History
| Date | Status | Borrower | Loan Amount |
|---|---|---|---|
| Open | Mccleary Lawrence S | $224,000 |
Source: Public Records
Tax History Compared to Growth
Tax History
| Year | Tax Paid | Tax Assessment Tax Assessment Total Assessment is a certain percentage of the fair market value that is determined by local assessors to be the total taxable value of land and additions on the property. | Land | Improvement |
|---|---|---|---|---|
| 2025 | $8,828 | $43,951 | $12,388 | $31,563 |
| 2024 | $8,828 | $43,951 | $12,770 | $31,181 |
| 2023 | $8,676 | $43,195 | $13,876 | $29,319 |
| 2022 | $7,797 | $56,640 | $17,520 | $39,120 |
| 2021 | $8,170 | $53,100 | $17,520 | $35,580 |
| 2020 | $7,753 | $53,940 | $17,520 | $36,420 |
| 2019 | $7,662 | $58,860 | $17,520 | $41,340 |
| 2018 | $7,338 | $35,996 | $13,668 | $22,328 |
| 2017 | $6,990 | $34,292 | $14,244 | $20,048 |
| 2016 | $6,467 | $34,292 | $14,244 | $20,048 |
| 2015 | $3,682 | $30,522 | $13,987 | $16,535 |
| 2014 | $3,682 | $30,522 | $16,790 | $13,732 |
Source: Public Records
Map
Nearby Homes