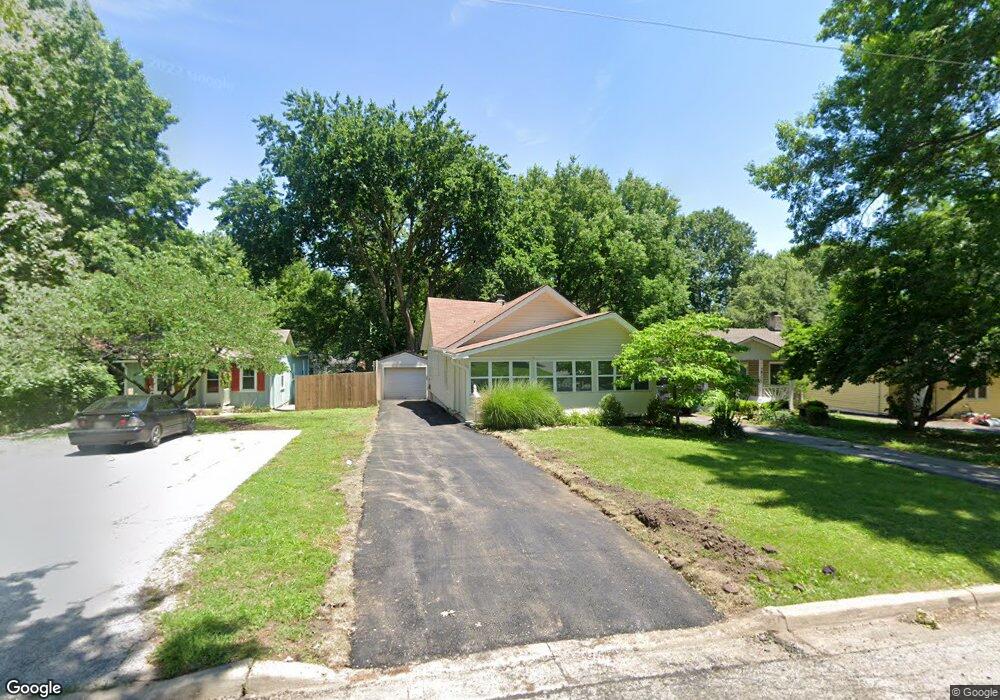
7809 Summit St Kansas City, MO 64114
Waldo NeighborhoodEstimated Value: $211,110 - $246,000
2
Beds
1
Bath
816
Sq Ft
$277/Sq Ft
Est. Value
About This Home
This home is located at 7809 Summit St, Kansas City, MO 64114 and is currently estimated at $226,028, approximately $276 per square foot. 7809 Summit St is a home located in Jackson County with nearby schools including Hale Cook Elementary, Central Middle School, and Southeast High School.
Ownership History
Date
Name
Owned For
Owner Type
Purchase Details
Closed on
Oct 16, 2024
Sold by
Jhs Rentals Llc-Series 7809
Bought by
Miller Jamie L and Miller Christopher L
Current Estimated Value
Home Financials for this Owner
Home Financials are based on the most recent Mortgage that was taken out on this home.
Original Mortgage
$120,000
Outstanding Balance
$118,738
Interest Rate
6.35%
Mortgage Type
New Conventional
Estimated Equity
$107,290
Purchase Details
Closed on
Aug 30, 2019
Sold by
Stuerke John
Bought by
Jhs Rentals Llc Series 7809
Purchase Details
Closed on
Dec 10, 2018
Sold by
Niederbremer Ann and Niederbremer Jon
Bought by
Stuerke John
Purchase Details
Closed on
Apr 15, 2008
Sold by
Davis Todd and Davis Ann M
Bought by
Davis Ann M
Home Financials for this Owner
Home Financials are based on the most recent Mortgage that was taken out on this home.
Original Mortgage
$98,500
Interest Rate
6%
Mortgage Type
Stand Alone Refi Refinance Of Original Loan
Purchase Details
Closed on
Nov 28, 2007
Sold by
Davis Todd
Bought by
Davis Ann M
Purchase Details
Closed on
Mar 28, 1997
Sold by
Owings Krina A
Bought by
Shelby Betty A
Create a Home Valuation Report for This Property
The Home Valuation Report is an in-depth analysis detailing your home's value as well as a comparison with similar homes in the area
Home Values in the Area
Average Home Value in this Area
Purchase History
| Date | Buyer | Sale Price | Title Company |
|---|---|---|---|
| Miller Jamie L | -- | None Listed On Document | |
| Jhs Rentals Llc Series 7809 | -- | None Available | |
| Stuerke John | -- | Assured Quality Title Co | |
| Davis Ann M | -- | None Available | |
| Davis Ann M | -- | None Available | |
| Shelby Betty A | -- | -- |
Source: Public Records
Mortgage History
| Date | Status | Borrower | Loan Amount |
|---|---|---|---|
| Open | Miller Jamie L | $120,000 | |
| Previous Owner | Davis Ann M | $98,500 |
Source: Public Records
Tax History Compared to Growth
Tax History
| Year | Tax Paid | Tax Assessment Tax Assessment Total Assessment is a certain percentage of the fair market value that is determined by local assessors to be the total taxable value of land and additions on the property. | Land | Improvement |
|---|---|---|---|---|
| 2025 | $2,162 | $31,500 | $5,875 | $25,625 |
| 2024 | $2,141 | $27,392 | $3,612 | $23,780 |
| 2023 | $2,141 | $27,393 | $3,785 | $23,608 |
| 2022 | $2,000 | $24,320 | $4,693 | $19,627 |
| 2021 | $1,994 | $24,320 | $4,693 | $19,627 |
| 2020 | $1,772 | $21,348 | $4,693 | $16,655 |
| 2019 | $1,735 | $21,348 | $4,693 | $16,655 |
| 2018 | $1,679 | $21,098 | $4,114 | $16,984 |
| 2017 | $1,679 | $21,098 | $4,114 | $16,984 |
| 2016 | $1,647 | $20,569 | $2,419 | $18,150 |
| 2014 | $1,619 | $20,165 | $2,371 | $17,794 |
Source: Public Records
Map
Nearby Homes
- 7826 Summit St
- 514 W 77th St
- 7544 Summit St
- 7602 Pennsylvania Ave
- 1127 W 76th Terrace
- 7515 Jefferson St
- 7514 Pennsylvania Ave
- 826 W 75th St
- 7615 Terrace St
- 208 W 81st St
- 7416 Belleview Ave
- 24 W 78th Terrace
- 8117 Summit St
- 615 W 74th St
- 8020 Mercier St
- 18 W 79th Terrace
- 109 W 80th St
- 8110 Ward Parkway Plaza
- 7603 Main St
- 8107 Ward Pkwy
- 7803 Summit St
- 7811 Summit St
- 7813 Summit St
- 7815 Summit St
- 7808 Summit St
- 7801 Summit St
- 7812 Summit St
- 7804 Summit St
- 7821 Summit St
- 7816 Summit St
- 7800 Summit St
- 7733 Summit St
- 7822 Summit St
- 7825 Summit St
- 7729 Summit St
- 7824 Jefferson St
- 7808 Jefferson St
- 7804 Jefferson St
- 7812 Jefferson St
- 7800 Jefferson St