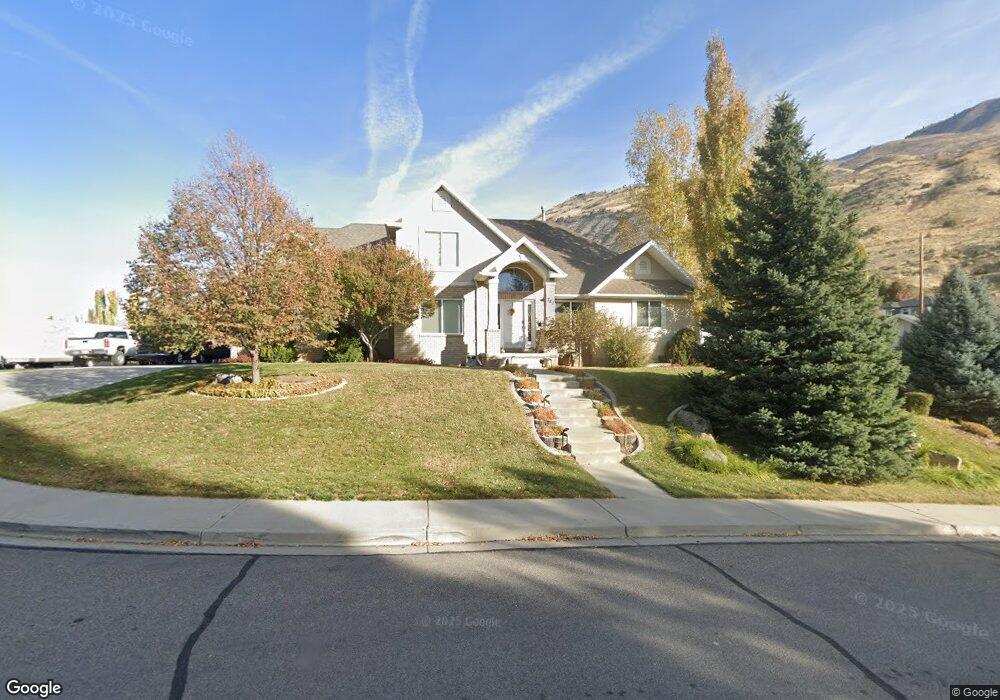
781 E 550 N Lindon, UT 84042
Estimated Value: $582,000 - $727,000
3
Beds
3
Baths
2,250
Sq Ft
$298/Sq Ft
Est. Value
About This Home
This home is located at 781 E 550 N, Lindon, UT 84042 and is currently estimated at $670,198, approximately $297 per square foot. 781 E 550 N is a home located in Utah County with nearby schools including Lindon Elementary School, Oak Canyon Junior High School, and Pleasant Grove High School.
Ownership History
Date
Name
Owned For
Owner Type
Purchase Details
Closed on
Apr 10, 2017
Sold by
Sargent Mark E and Sargent Debbie R
Bought by
Sargent Amrk E and Sargent Debbie
Current Estimated Value
Purchase Details
Closed on
Sep 15, 1999
Sold by
Knight West Construction Inc
Bought by
Sargent Mark E and Sargent Debbie R
Home Financials for this Owner
Home Financials are based on the most recent Mortgage that was taken out on this home.
Original Mortgage
$273,000
Interest Rate
7.75%
Mortgage Type
Seller Take Back
Purchase Details
Closed on
Jun 24, 1999
Sold by
Timpridge Development Inc
Bought by
Knight West Construction Inc
Home Financials for this Owner
Home Financials are based on the most recent Mortgage that was taken out on this home.
Original Mortgage
$198,000
Interest Rate
7.05%
Mortgage Type
Construction
Create a Home Valuation Report for This Property
The Home Valuation Report is an in-depth analysis detailing your home's value as well as a comparison with similar homes in the area
Home Values in the Area
Average Home Value in this Area
Purchase History
| Date | Buyer | Sale Price | Title Company |
|---|---|---|---|
| Sargent Amrk E | -- | None Available | |
| Sargent Mark E | -- | Signature Title | |
| Knight West Construction Inc | -- | Signature Title |
Source: Public Records
Mortgage History
| Date | Status | Borrower | Loan Amount |
|---|---|---|---|
| Previous Owner | Sargent Mark E | $273,000 | |
| Previous Owner | Knight West Construction Inc | $198,000 |
Source: Public Records
Tax History
| Year | Tax Paid | Tax Assessment Tax Assessment Total Assessment is a certain percentage of the fair market value that is determined by local assessors to be the total taxable value of land and additions on the property. | Land | Improvement |
|---|---|---|---|---|
| 2025 | $2,660 | $340,780 | -- | -- |
| 2024 | $2,660 | $327,910 | $0 | $0 |
| 2023 | $2,564 | $339,515 | $0 | $0 |
| 2022 | $2,524 | $322,850 | $0 | $0 |
| 2021 | $2,422 | $467,200 | $211,900 | $255,300 |
| 2020 | $2,307 | $438,100 | $192,600 | $245,500 |
| 2019 | $2,135 | $423,000 | $177,500 | $245,500 |
| 2018 | $2,163 | $404,000 | $162,400 | $241,600 |
| 2017 | $2,198 | $220,110 | $0 | $0 |
| 2016 | $2,307 | $213,675 | $0 | $0 |
| 2015 | $2,405 | $210,595 | $0 | $0 |
| 2014 | $2,302 | $199,650 | $0 | $0 |
Source: Public Records
Map
Nearby Homes