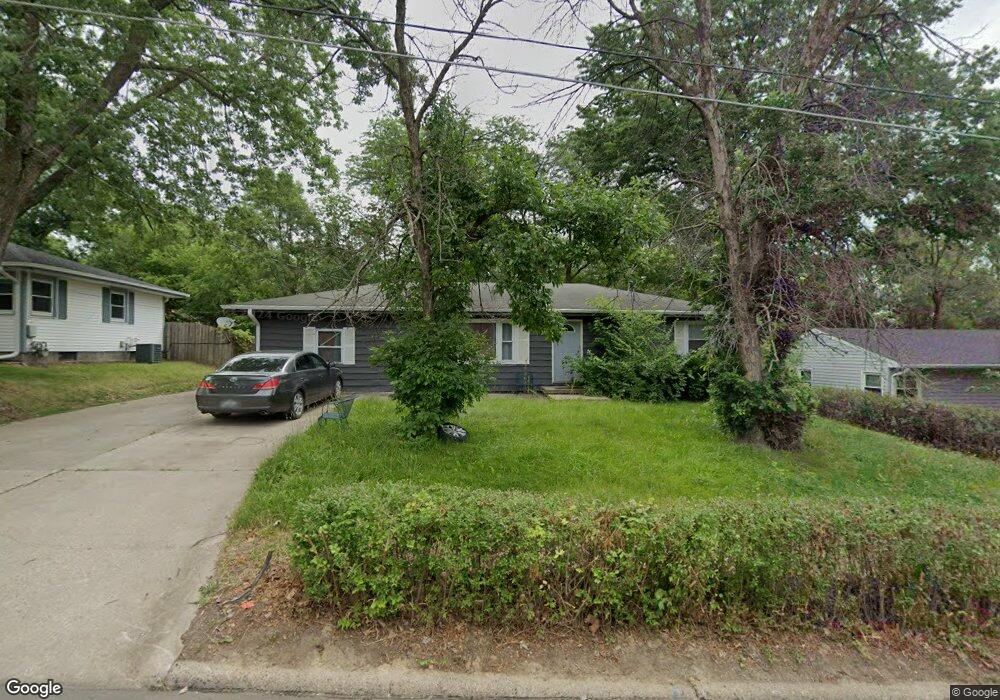
7811 SW 10th Place Des Moines, IA 50315
Watrous South NeighborhoodEstimated Value: $225,000 - $237,000
4
Beds
1
Bath
1,296
Sq Ft
$177/Sq Ft
Est. Value
About This Home
This home is located at 7811 SW 10th Place, Des Moines, IA 50315 and is currently estimated at $229,659, approximately $177 per square foot. 7811 SW 10th Place is a home located in Polk County with nearby schools including Morris Elementary School, Mccombs Middle School, and Lincoln High School.
Ownership History
Date
Name
Owned For
Owner Type
Purchase Details
Closed on
Jan 17, 2015
Sold by
Brent Smith Mary A and Smith David
Bought by
Brent Smith Mary A
Current Estimated Value
Home Financials for this Owner
Home Financials are based on the most recent Mortgage that was taken out on this home.
Original Mortgage
$128,908
Outstanding Balance
$100,632
Interest Rate
4.37%
Mortgage Type
FHA
Estimated Equity
$129,027
Purchase Details
Closed on
Jan 20, 2006
Sold by
Coleman John G and Coleman Phyllis Ann Smith
Bought by
Brent Mary A
Home Financials for this Owner
Home Financials are based on the most recent Mortgage that was taken out on this home.
Original Mortgage
$25,980
Interest Rate
5.91%
Mortgage Type
Stand Alone Second
Purchase Details
Closed on
Apr 18, 2002
Sold by
Coleman John G and Coleman Phyllis Ann Smith
Bought by
Coleman John G and Coleman Phyllis Ann Smith
Create a Home Valuation Report for This Property
The Home Valuation Report is an in-depth analysis detailing your home's value as well as a comparison with similar homes in the area
Home Values in the Area
Average Home Value in this Area
Purchase History
| Date | Buyer | Sale Price | Title Company |
|---|---|---|---|
| Brent Smith Mary A | -- | None Available | |
| Brent Mary A | $129,500 | None Available | |
| Coleman John G | -- | -- |
Source: Public Records
Mortgage History
| Date | Status | Borrower | Loan Amount |
|---|---|---|---|
| Open | Brent Smith Mary A | $128,908 | |
| Closed | Brent Mary A | $25,980 | |
| Closed | Brent Mary A | $103,920 |
Source: Public Records
Tax History Compared to Growth
Tax History
| Year | Tax Paid | Tax Assessment Tax Assessment Total Assessment is a certain percentage of the fair market value that is determined by local assessors to be the total taxable value of land and additions on the property. | Land | Improvement |
|---|---|---|---|---|
| 2025 | $4,134 | $249,500 | $34,800 | $214,700 |
| 2024 | $4,134 | $220,600 | $30,200 | $190,400 |
| 2023 | $4,044 | $220,600 | $30,200 | $190,400 |
| 2022 | $4,012 | $180,500 | $26,000 | $154,500 |
| 2021 | $3,760 | $180,500 | $26,000 | $154,500 |
| 2020 | $3,902 | $159,300 | $22,800 | $136,500 |
| 2019 | $3,546 | $159,300 | $22,800 | $136,500 |
| 2018 | $3,506 | $140,500 | $19,700 | $120,800 |
| 2017 | $3,388 | $140,500 | $19,700 | $120,800 |
| 2016 | $3,296 | $133,800 | $18,400 | $115,400 |
| 2015 | $3,296 | $133,800 | $18,400 | $115,400 |
| 2014 | $3,238 | $135,400 | $18,200 | $117,200 |
Source: Public Records
Map
Nearby Homes
- 7460 Southview Dr
- 7500 SW 12th St
- 1010 Amos Ave
- 1306 Amos Ave
- 1115 Wade St
- 7306 SW 16th St
- 1334 Wade St
- 1115 Rittenhouse St
- 8046 Crestview Dr
- 1313 Burnham Ave
- 7910 SE 1st Ct
- 1029 Bundy St
- 1161 Bundy St
- 154 Crossroads Dr
- 7807 SE 2nd St
- 8053 Ridgeview Dr
- 1225 West St
- 8066 Pilmer Dr
- 8517 Crestview Dr
- RR Fleur Dr
- 7807 SW 10th Place
- 7815 SW 10th Place
- 7810 SW 10th St
- 7806 SW 10th St
- 7814 SW 10th St
- 7803 SW 10th Place
- 7903 SW 10th Place
- 7810 SW 10th Place
- 7806 SW 10th Place
- 7802 SW 10th St
- 7902 SW 10th St
- 7902 SW 10th Place
- 7715 SW 10th Place
- 7907 SW 10th Place
- 7802 SW 10th Place
- 7714 SW 10th St
- 7906 SW 10th St
- 7906 SW 10th Place
- 7714 SW 10th Place
- 7807 SW 10th St