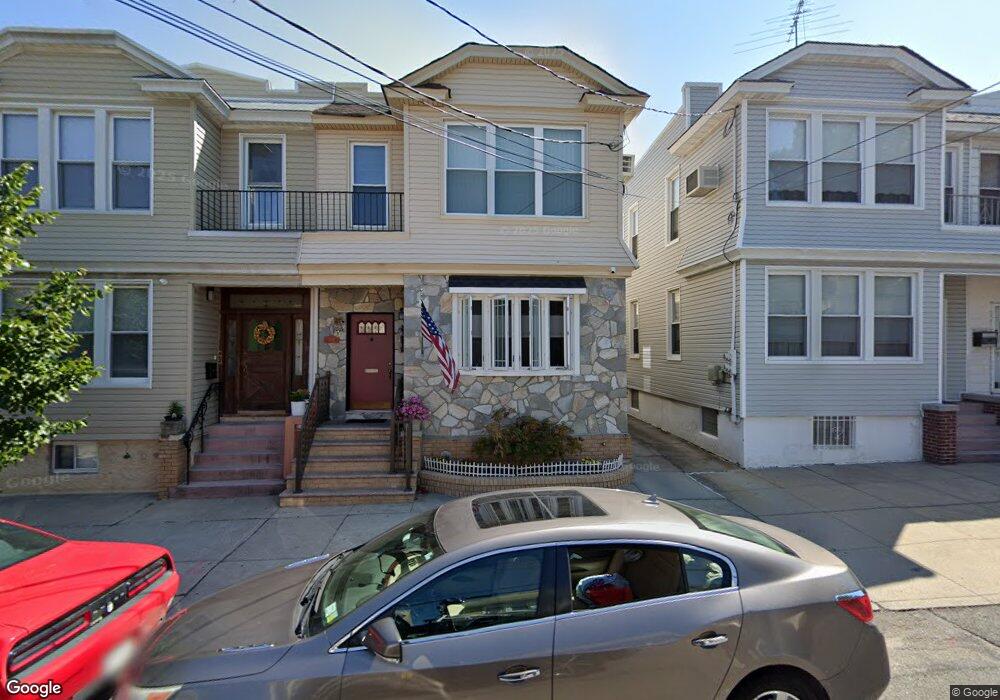
7817 85th St Glendale, NY 11385
Glendale NeighborhoodEstimated Value: $996,604 - $1,243,000
Studio
--
Bath
2,440
Sq Ft
$461/Sq Ft
Est. Value
About This Home
This home is located at 7817 85th St, Glendale, NY 11385 and is currently estimated at $1,125,651, approximately $461 per square foot. 7817 85th St is a home located in Queens County with nearby schools including P.S./I.S. 113 Anthony J. Pranzo School, Queens Metropolitan High School, and Elm Community Charter School.
Ownership History
Date
Name
Owned For
Owner Type
Purchase Details
Closed on
May 15, 2019
Sold by
Glaser Eileen A and Lowery Brian E
Bought by
Meta Myfit
Current Estimated Value
Home Financials for this Owner
Home Financials are based on the most recent Mortgage that was taken out on this home.
Original Mortgage
$600,000
Outstanding Balance
$524,245
Interest Rate
4.1%
Mortgage Type
New Conventional
Estimated Equity
$601,406
Purchase Details
Closed on
Mar 26, 2004
Sold by
Lowery Edna A
Bought by
Glaser Eileen A and Lowery Brian E
Create a Home Valuation Report for This Property
The Home Valuation Report is an in-depth analysis detailing your home's value as well as a comparison with similar homes in the area
Home Values in the Area
Average Home Value in this Area
Purchase History
| Date | Buyer | Sale Price | Title Company |
|---|---|---|---|
| Meta Myfit | $850,000 | -- | |
| Meta Myfit | $850,000 | -- | |
| Glaser Eileen A | -- | -- | |
| Glaser Eileen A | -- | -- |
Source: Public Records
Mortgage History
| Date | Status | Borrower | Loan Amount |
|---|---|---|---|
| Open | Meta Myfit | $600,000 | |
| Closed | Meta Myfit | $600,000 |
Source: Public Records
Tax History
| Year | Tax Paid | Tax Assessment Tax Assessment Total Assessment is a certain percentage of the fair market value that is determined by local assessors to be the total taxable value of land and additions on the property. | Land | Improvement |
|---|---|---|---|---|
| 2025 | $9,211 | $45,863 | $10,963 | $34,900 |
| 2024 | $9,211 | $45,862 | $11,486 | $34,376 |
| 2023 | $8,996 | $44,789 | $10,525 | $34,264 |
| 2022 | $8,572 | $64,500 | $16,680 | $47,820 |
| 2021 | $7,515 | $54,840 | $16,680 | $38,160 |
| 2020 | $7,074 | $55,020 | $16,680 | $38,340 |
| 2019 | $6,991 | $56,460 | $16,680 | $39,780 |
| 2018 | $6,332 | $37,324 | $12,486 | $24,838 |
| 2017 | $6,407 | $35,781 | $13,815 | $21,966 |
| 2016 | $5,855 | $35,781 | $13,815 | $21,966 |
| 2015 | $3,509 | $31,849 | $14,601 | $17,248 |
| 2014 | $3,509 | $31,849 | $15,822 | $16,027 |
Source: Public Records
Map
Nearby Homes