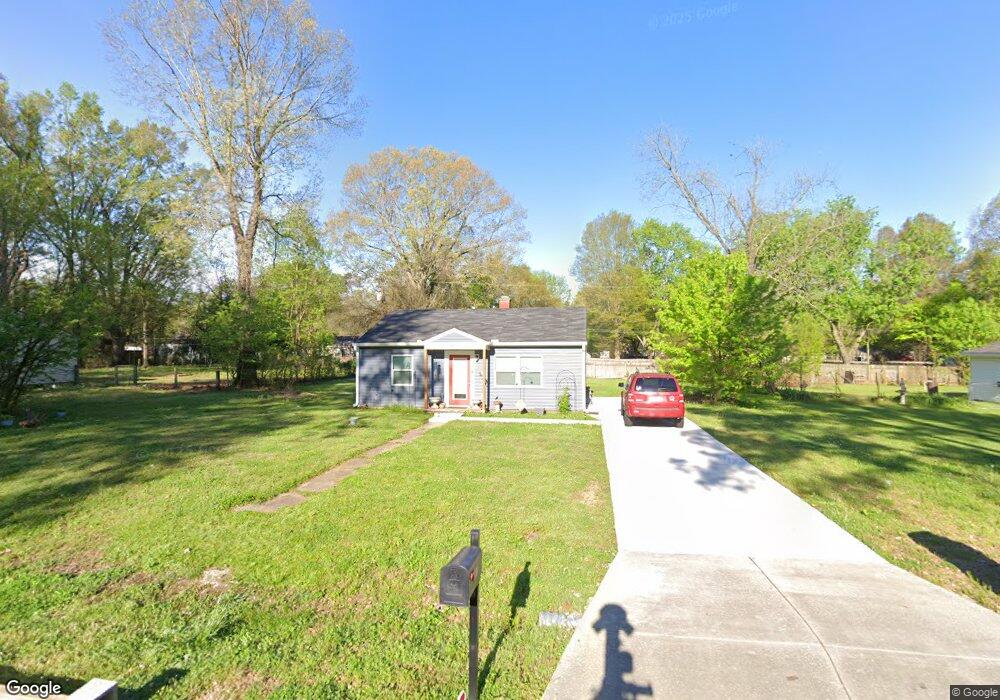
7819 Admiral Rd Millington, TN 38053
Estimated Value: $21,714 - $144,000
2
Beds
1
Bath
750
Sq Ft
$138/Sq Ft
Est. Value
About This Home
This home is located at 7819 Admiral Rd, Millington, TN 38053 and is currently estimated at $103,429, approximately $137 per square foot. 7819 Admiral Rd is a home located in Shelby County with nearby schools including Millington Elementary School, Millington High School, and Tipton-Rosemark Academy.
Ownership History
Date
Name
Owned For
Owner Type
Purchase Details
Closed on
Dec 4, 2020
Sold by
Law Antoinette G and Estes Tabrina
Bought by
Estes Tabrina and Estes Genevieve
Current Estimated Value
Home Financials for this Owner
Home Financials are based on the most recent Mortgage that was taken out on this home.
Original Mortgage
$36,000
Interest Rate
2.7%
Mortgage Type
Commercial
Purchase Details
Closed on
Jun 24, 2020
Sold by
Redditt Robert
Bought by
Law Antoinette G and Estes Tabrina
Purchase Details
Closed on
Mar 4, 2010
Sold by
Pettit Jack and Pettit Shirley
Bought by
Redditt Robert
Purchase Details
Closed on
Jan 9, 2006
Sold by
Pettit Jack F
Bought by
Pettit Jack F and Pettit Shirley A
Purchase Details
Closed on
Oct 11, 2004
Sold by
Hemness Niki Chandler and Hemness Edwin Nicholas
Bought by
Pettit Jack Forest
Create a Home Valuation Report for This Property
The Home Valuation Report is an in-depth analysis detailing your home's value as well as a comparison with similar homes in the area
Home Values in the Area
Average Home Value in this Area
Purchase History
| Date | Buyer | Sale Price | Title Company |
|---|---|---|---|
| Estes Tabrina | -- | None Available | |
| Law Antoinette G | $13,500 | None Available | |
| Redditt Robert | $4,000 | None Available | |
| Pettit Jack F | -- | -- | |
| Pettit Jack Forest | -- | -- |
Source: Public Records
Mortgage History
| Date | Status | Borrower | Loan Amount |
|---|---|---|---|
| Closed | Estes Tabrina | $36,000 |
Source: Public Records
Tax History Compared to Growth
Tax History
| Year | Tax Paid | Tax Assessment Tax Assessment Total Assessment is a certain percentage of the fair market value that is determined by local assessors to be the total taxable value of land and additions on the property. | Land | Improvement |
|---|---|---|---|---|
| 2025 | $399 | $18,900 | $3,250 | $15,650 |
| 2024 | $399 | $11,775 | $2,250 | $9,525 |
| 2023 | $399 | $11,775 | $2,250 | $9,525 |
| 2022 | $399 | $11,775 | $2,250 | $9,525 |
| 2021 | $477 | $11,775 | $2,250 | $9,525 |
| 2020 | $345 | $8,525 | $2,250 | $6,275 |
| 2019 | $345 | $8,525 | $2,250 | $6,275 |
| 2018 | $345 | $8,525 | $2,250 | $6,275 |
| 2017 | $350 | $8,525 | $2,250 | $6,275 |
| 2016 | $368 | $8,425 | $0 | $0 |
| 2014 | $368 | $8,425 | $0 | $0 |
Source: Public Records
Map
Nearby Homes
- 7814 Commodore Rd
- 7804 Commodore Rd
- 7783 Commodore Rd
- 7825 Mahoney Rd
- 7754 Shamrock Rd
- 7881 Sherman Rd
- 7702 Marvin Rd
- 7194 Millington Arlington Rd
- 6948 Northknoll Ave
- 6367 Raible Dr
- 6296 Woodgreen Dr
- 0 Sledge Rd
- 0 McCalla Rd
- 8622 Millington Arlington Rd
- 6580 Austin Peay Hwy
- 6185 Ricks Rd
- 6275 Ricks Rd
- 8314 Millington Arlington Rd
- 0 Bethuel Church Rd Unit RTC2971170
- 8371 McCalla Rd
- 7809 Admiral Rd
- 7824 Commodore Rd
- 7834 Commodore Rd
- 7820 Admiral Rd
- 7799 Admiral Rd
- 7839 Admiral Rd
- 7810 Admiral Rd
- 7830 Admiral Rd
- 7844 Commodore Rd
- 7800 Admiral Rd
- 7840 Admiral Rd
- 7789 Admiral Rd
- 7849 Admiral Rd
- 7794 Commodore Rd
- 7854 Commodore Rd
- 7823 Commodore Rd
- 7815 Shamrock Rd
- 7805 Shamrock Rd
- 7833 Commodore Rd
- 7813 Commodore Rd