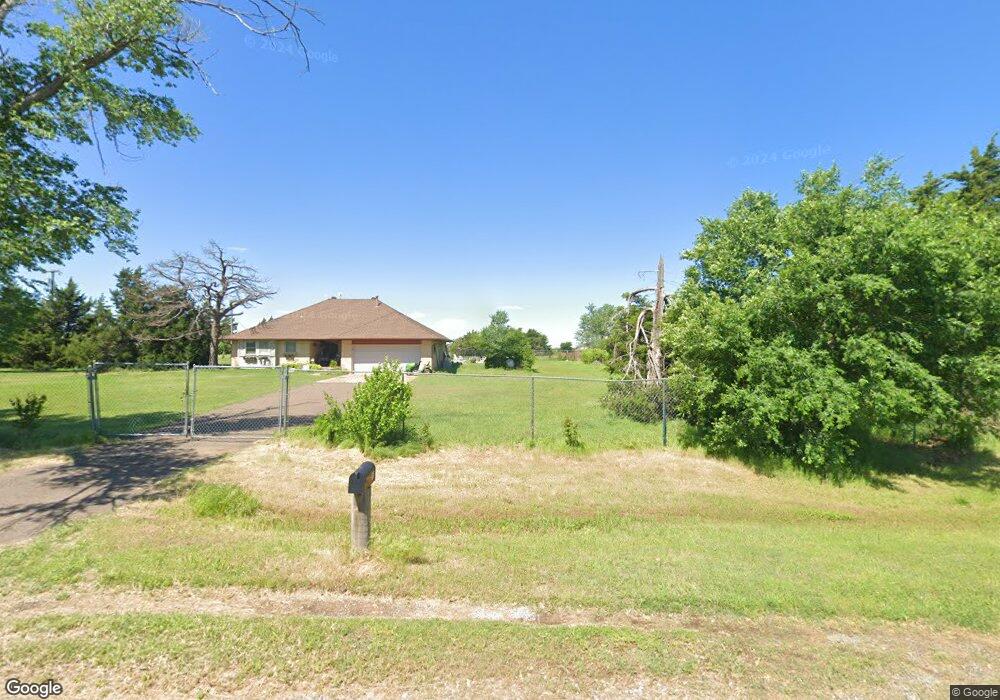
7819 N Burns Rd Edmond, OK 73025
Estimated Value: $272,925 - $336,000
4
Beds
2
Baths
1,497
Sq Ft
$209/Sq Ft
Est. Value
About This Home
This home is located at 7819 N Burns Rd, Edmond, OK 73025 and is currently estimated at $312,481, approximately $208 per square foot. 7819 N Burns Rd is a home located in Logan County with nearby schools including Prairie Vale Elementary School, Deer Creek Middle School, and Deer Creek Intermediate School.
Ownership History
Date
Name
Owned For
Owner Type
Purchase Details
Closed on
May 27, 2010
Sold by
Safi Carol M
Bought by
Shank James I and Safi Carol M
Current Estimated Value
Purchase Details
Closed on
Jul 30, 2007
Sold by
Moreno Ruben A and Moreno Marla De Lourdes
Bought by
Safi Carol M and Safi Carol
Home Financials for this Owner
Home Financials are based on the most recent Mortgage that was taken out on this home.
Original Mortgage
$131,040
Outstanding Balance
$82,883
Interest Rate
6.73%
Mortgage Type
New Conventional
Estimated Equity
$229,598
Purchase Details
Closed on
Aug 5, 2005
Sold by
Mowdy Betty and Mowdy Betty J
Bought by
Moreno Ruben A and Moreno Mariade Lourdes
Home Financials for this Owner
Home Financials are based on the most recent Mortgage that was taken out on this home.
Original Mortgage
$153,000
Interest Rate
5.51%
Mortgage Type
New Conventional
Create a Home Valuation Report for This Property
The Home Valuation Report is an in-depth analysis detailing your home's value as well as a comparison with similar homes in the area
Home Values in the Area
Average Home Value in this Area
Purchase History
| Date | Buyer | Sale Price | Title Company |
|---|---|---|---|
| Shank James I | -- | None Available | |
| Safi Carol M | $164,000 | Capital Abstract & Title | |
| Moreno Ruben A | $153,000 | None Available |
Source: Public Records
Mortgage History
| Date | Status | Borrower | Loan Amount |
|---|---|---|---|
| Open | Safi Carol M | $131,040 | |
| Previous Owner | Moreno Ruben A | $153,000 |
Source: Public Records
Tax History Compared to Growth
Tax History
| Year | Tax Paid | Tax Assessment Tax Assessment Total Assessment is a certain percentage of the fair market value that is determined by local assessors to be the total taxable value of land and additions on the property. | Land | Improvement |
|---|---|---|---|---|
| 2025 | $2,058 | $17,923 | $1,499 | $16,424 |
| 2024 | $2,058 | $17,401 | $1,499 | $15,902 |
| 2023 | $2,058 | $16,894 | $1,499 | $15,395 |
| 2022 | $1,872 | $16,402 | $1,499 | $14,903 |
| 2021 | $1,790 | $15,925 | $1,499 | $14,426 |
| 2020 | $1,798 | $15,461 | $1,499 | $13,962 |
| 2019 | $1,839 | $15,619 | $1,499 | $14,120 |
| 2018 | $1,825 | $15,619 | $1,499 | $14,120 |
| 2017 | $1,837 | $15,619 | $1,499 | $14,120 |
| 2016 | $1,810 | $15,488 | $1,499 | $13,989 |
| 2014 | $1,469 | $12,891 | $1,170 | $11,721 |
| 2013 | $1,633 | $14,063 | $1,276 | $12,787 |
Source: Public Records
Map
Nearby Homes
- 13460 Blue Star St
- 13172 Mannington Rd
- 4648 Kensington Way
- 13156 Mannington Rd
- 13157 Huntington Dr
- 13310 S Pennsylvania Ave
- 13420 Saltgrass Dr
- 9765 Livingston Rd
- 9801 Livingston Rd
- 14550 S Pennsylvania Ave
- 4150 W Waterloo Rd
- 1851 Silver Oaks Dr
- 9881 Livingston Rd
- 4350 Deer Crossing
- 1720 Silver Oaks Dr
- 8681 Oak Tree Cir
- 8651 Oak Tree Cir
- 8621 Oak Tree Cir
- 4676 Ranchero Dr
- 2717 Charleston Rd
- 7801 N Burns Rd
- 7818 N Burns Rd
- 7909 N Burns Rd
- 7910 N Burns Rd
- 7723 N Burns Rd
- 7617 N Burns Rd
- 8000 N Burns Rd
- 3939 W Burns Rd
- 8145 N Burns Rd
- 13300 Prairie Cir
- 8100 N Burns Rd
- 13901 S Western Ave
- 13801 S Western Ave
- 8225 N Burns Rd
- 13651 S Western Ave
- 8180 N Burns Rd
- 13740 Blue Star St
- 8801 W Simmons Rd
- 3801 W Burns Rd
- 8651 W Simmons Rd