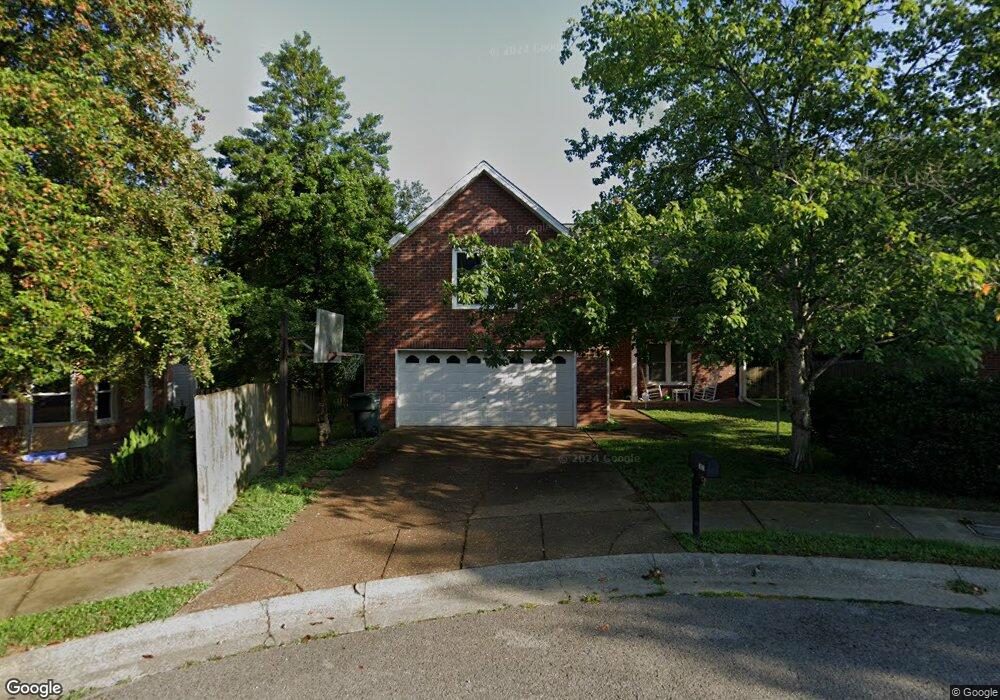
7821 Dan Kestner Ct Nashville, TN 37221
Bellevue NeighborhoodEstimated Value: $511,140 - $548,000
3
Beds
2
Baths
2,288
Sq Ft
$233/Sq Ft
Est. Value
About This Home
This home is located at 7821 Dan Kestner Ct, Nashville, TN 37221 and is currently estimated at $532,535, approximately $232 per square foot. 7821 Dan Kestner Ct is a home located in Davidson County with nearby schools including Westmeade Elementary School, Bellevue Middle School, and Hillwood High.
Ownership History
Date
Name
Owned For
Owner Type
Purchase Details
Closed on
Feb 29, 2008
Sold by
Hargis Robert C and Hargis Lee F
Bought by
Owens Adam T and Owens Jessica A
Current Estimated Value
Home Financials for this Owner
Home Financials are based on the most recent Mortgage that was taken out on this home.
Original Mortgage
$213,750
Outstanding Balance
$131,150
Interest Rate
5.46%
Mortgage Type
Unknown
Estimated Equity
$401,385
Purchase Details
Closed on
Apr 30, 2003
Sold by
Kafader Mark E and Kafader Lisa
Bought by
Hargis Robert C and Hargis Lee F
Home Financials for this Owner
Home Financials are based on the most recent Mortgage that was taken out on this home.
Original Mortgage
$182,300
Interest Rate
5.86%
Mortgage Type
Unknown
Purchase Details
Closed on
Aug 16, 1996
Sold by
Buddy Dunn Contractors Lp
Bought by
Kafader Mark E and Kafader Lisa
Create a Home Valuation Report for This Property
The Home Valuation Report is an in-depth analysis detailing your home's value as well as a comparison with similar homes in the area
Home Values in the Area
Average Home Value in this Area
Purchase History
| Date | Buyer | Sale Price | Title Company |
|---|---|---|---|
| Owens Adam T | $225,000 | Watauga Title Company | |
| Hargis Robert C | $177,000 | Realty Title & Escrow Co Inc | |
| Kafader Mark E | $152,900 | -- |
Source: Public Records
Mortgage History
| Date | Status | Borrower | Loan Amount |
|---|---|---|---|
| Open | Owens Adam T | $213,750 | |
| Previous Owner | Hargis Robert C | $182,300 |
Source: Public Records
Tax History Compared to Growth
Tax History
| Year | Tax Paid | Tax Assessment Tax Assessment Total Assessment is a certain percentage of the fair market value that is determined by local assessors to be the total taxable value of land and additions on the property. | Land | Improvement |
|---|---|---|---|---|
| 2024 | $2,771 | $94,825 | $13,000 | $81,825 |
| 2023 | $2,771 | $94,825 | $13,000 | $81,825 |
| 2022 | $2,771 | $94,825 | $13,000 | $81,825 |
| 2021 | $2,800 | $94,825 | $13,000 | $81,825 |
| 2020 | $2,884 | $76,125 | $13,000 | $63,125 |
| 2019 | $2,097 | $76,125 | $13,000 | $63,125 |
| 2018 | $2,097 | $76,125 | $13,000 | $63,125 |
| 2017 | $2,097 | $76,125 | $13,000 | $63,125 |
| 2016 | $1,774 | $45,200 | $9,000 | $36,200 |
| 2015 | $1,774 | $45,200 | $9,000 | $36,200 |
| 2014 | $1,774 | $45,200 | $9,000 | $36,200 |
Source: Public Records
Map
Nearby Homes
- 7825 Sawyer Brown Rd
- 633 Hicks Rd
- 7774 Sawyer Brown Rd
- 557 Holt Valley Rd
- 500 Stacy Square Terrace Unit 500
- 225 Colt Dr
- 264 New Sawyer Brown Rd
- 266 New Sawyer Brown Rd
- 8041 Arbor Dr
- 780 Summit Oaks Ct
- 772 Summit Oaks Ct
- 768 Summit Oaks Ct
- 764 Summit Oaks Ct
- 784 Summit Oaks Ct
- 776 Summit Oaks Ct
- 752 Summit Oaks Ct
- 760 Summit Oaks Ct
- 756 Summit Oaks Ct
- 7717 Sawyer Brown Rd Unit A
- 212 Post Creek Rd Unit 212
- 7817 Dan Kestner Ct
- 7820 Dan Kestner Ct
- 7813 Dan Kestner Ct
- 200 New Sawyer Brown Rd
- 7816 Dan Kestner Ct
- 613 Meadow Lane Dr
- 7809 Dan Kestner Ct
- 601 Meadow Lane Dr
- 7812 Dan Kestner Ct
- 7933 Sawyer Brown Rd
- 609 Meadow Lane Dr
- 7808 Dan Kestner Ct
- 7805 Dan Kestner Ct
- 605 Meadow Lane Dr
- 204 New Sawyer Brown Rd
- 7937 Sawyer Brown Rd
- 7804 Dan Kestner Ct
- 205 New Sawyer Brown Rd
- 215 Sawyer Brown Ct
- 7705 Dan Kestner Dr