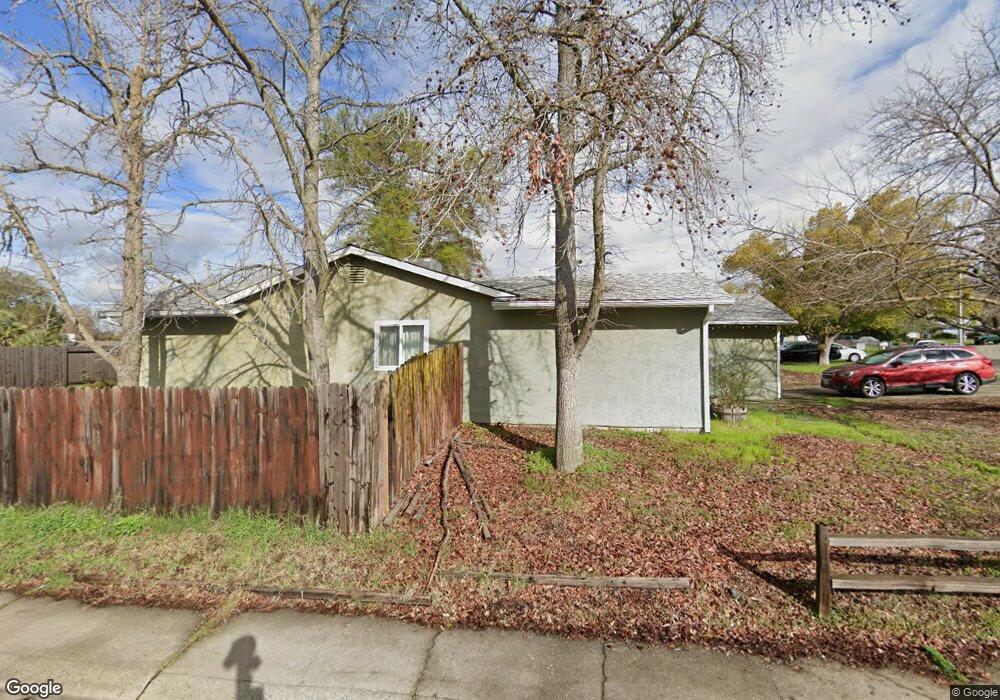
7821 Tabare Ct Citrus Heights, CA 95621
Estimated Value: $129,000 - $453,000
3
Beds
2
Baths
1,199
Sq Ft
$306/Sq Ft
Est. Value
About This Home
This home is located at 7821 Tabare Ct, Citrus Heights, CA 95621 and is currently estimated at $366,991, approximately $306 per square foot. 7821 Tabare Ct is a home located in Sacramento County with nearby schools including Grand Oaks Elementary School, Sylvan Middle School, and Mesa Verde High School.
Ownership History
Date
Name
Owned For
Owner Type
Purchase Details
Closed on
Aug 11, 2011
Sold by
Craighead Jason and Bohnett Monica
Bought by
Bilyeu Barbara L and Bilyeu Daniel E
Current Estimated Value
Home Financials for this Owner
Home Financials are based on the most recent Mortgage that was taken out on this home.
Original Mortgage
$119,881
Outstanding Balance
$83,697
Interest Rate
4.75%
Mortgage Type
FHA
Estimated Equity
$283,294
Purchase Details
Closed on
Mar 25, 2005
Sold by
Pickering Denise C
Bought by
Craighead Jason and Bohnett Monica
Home Financials for this Owner
Home Financials are based on the most recent Mortgage that was taken out on this home.
Original Mortgage
$270,400
Interest Rate
5.5%
Mortgage Type
Purchase Money Mortgage
Purchase Details
Closed on
Jan 9, 1995
Sold by
Pickering Denise C and Pickering Robert H
Bought by
Pickering Denise C
Create a Home Valuation Report for This Property
The Home Valuation Report is an in-depth analysis detailing your home's value as well as a comparison with similar homes in the area
Home Values in the Area
Average Home Value in this Area
Purchase History
| Date | Buyer | Sale Price | Title Company |
|---|---|---|---|
| Bilyeu Barbara L | $123,000 | First American Title Company | |
| Craighead Jason | $338,000 | California Title Company Of | |
| Pickering Denise C | -- | -- |
Source: Public Records
Mortgage History
| Date | Status | Borrower | Loan Amount |
|---|---|---|---|
| Open | Bilyeu Barbara L | $119,881 | |
| Previous Owner | Craighead Jason | $270,400 | |
| Closed | Craighead Jason | $67,600 |
Source: Public Records
Tax History Compared to Growth
Tax History
| Year | Tax Paid | Tax Assessment Tax Assessment Total Assessment is a certain percentage of the fair market value that is determined by local assessors to be the total taxable value of land and additions on the property. | Land | Improvement |
|---|---|---|---|---|
| 2025 | $1,761 | $154,483 | $65,937 | $88,546 |
| 2024 | $1,761 | $151,455 | $64,645 | $86,810 |
| 2023 | $1,715 | $148,486 | $63,378 | $85,108 |
| 2022 | $1,705 | $145,576 | $62,136 | $83,440 |
| 2021 | $1,675 | $142,722 | $60,918 | $81,804 |
| 2020 | $1,643 | $141,260 | $60,294 | $80,966 |
| 2019 | $1,609 | $138,491 | $59,112 | $79,379 |
| 2018 | $1,589 | $135,776 | $57,953 | $77,823 |
| 2017 | $1,572 | $133,115 | $56,817 | $76,298 |
| 2016 | $1,468 | $130,505 | $55,703 | $74,802 |
| 2015 | $1,442 | $128,546 | $54,867 | $73,679 |
| 2014 | $1,411 | $126,029 | $53,793 | $72,236 |
Source: Public Records
Map
Nearby Homes
- 7783 Live Oak Way
- 7128 Parish Way
- 7542 Pomerol Ln
- 8001 Lichen Dr
- 77012 Lauppe Ln
- 77020 Lauppe Ln
- 77094 Lauppe Ln
- 0 Muth Ln Unit 225125594
- 77066 Lauppe Ln
- 8031 Lichen Dr
- 8016 Lesser Way
- 7325 Little Oaks Way
- 7058 Enright Dr
- 6611 Branchwater Way
- 6633 Briartree Way
- 6600 Branchwater Way
- 7448 Grand Oaks Blvd
- 77262 Lauppe Ln
- 7006 Enright Dr
- 6721 Navion Dr
- 7825 Tabare Ct
- 7112 Parish Way
- 7829 Tabare Ct
- 7812 Tabare Ct
- 7808 Tabare Ct
- 7816 Tabare Ct
- 7116 Parish Way
- 7804 Tabare Ct
- 7833 Tabare Ct
- 7124 Parish Way
- 7800 Tabare Ct
- 7832 Tabare Ct
- 7837 Tabare Ct
- 7132 Parish Way
- 7104 Parish Way
- 7111 Parish Way
- 7841 Tabare Ct
- 7115 Parish Way
- 7838 Tabare Ct
- 7140 Parish Way