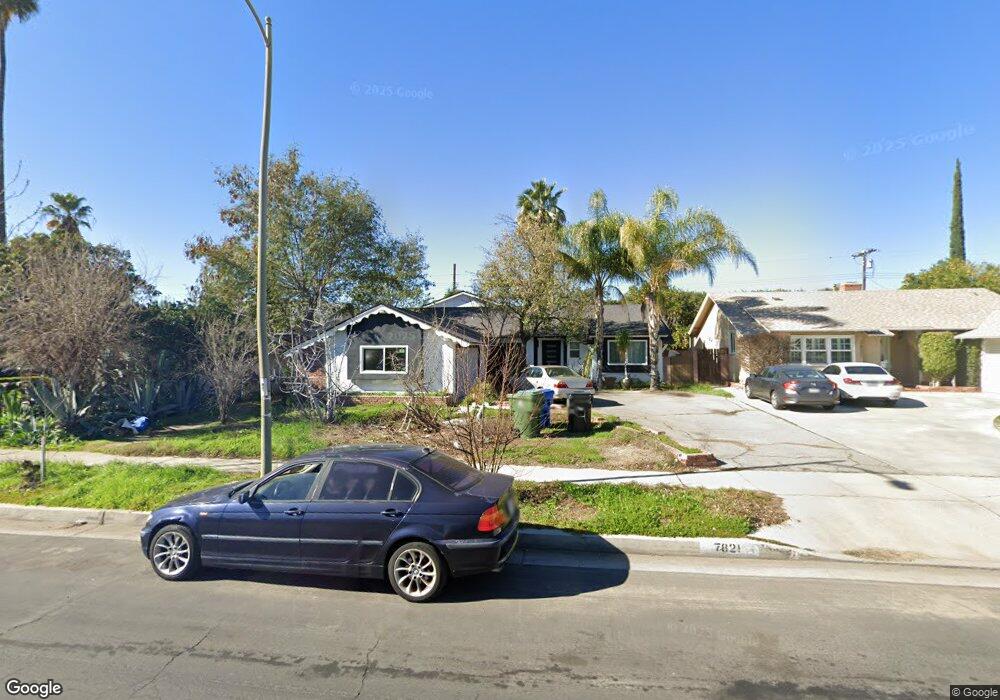
7821 Variel Ave Canoga Park, CA 91304
Canoga Park NeighborhoodEstimated Value: $855,000 - $982,000
5
Beds
2
Baths
1,962
Sq Ft
$465/Sq Ft
Est. Value
About This Home
This home is located at 7821 Variel Ave, Canoga Park, CA 91304 and is currently estimated at $913,021, approximately $465 per square foot. 7821 Variel Ave is a home located in Los Angeles County with nearby schools including Canoga Park Elementary School, Christopher Columbus Middle School, and Canoga Park Senior High School.
Ownership History
Date
Name
Owned For
Owner Type
Purchase Details
Closed on
Apr 25, 2016
Sold by
Nguyen Charles M
Bought by
Nguyen Charles M and Nguyen Johnny M
Current Estimated Value
Home Financials for this Owner
Home Financials are based on the most recent Mortgage that was taken out on this home.
Original Mortgage
$412,000
Outstanding Balance
$328,726
Interest Rate
3.73%
Mortgage Type
New Conventional
Estimated Equity
$584,295
Purchase Details
Closed on
Jan 3, 2006
Sold by
Nguyen Thuy Thanh
Bought by
Nguyen Johnny M
Home Financials for this Owner
Home Financials are based on the most recent Mortgage that was taken out on this home.
Original Mortgage
$99,000
Interest Rate
6.2%
Mortgage Type
Credit Line Revolving
Purchase Details
Closed on
Dec 23, 2005
Sold by
Draper James R
Bought by
Nguyen Charles M
Home Financials for this Owner
Home Financials are based on the most recent Mortgage that was taken out on this home.
Original Mortgage
$99,000
Interest Rate
6.2%
Mortgage Type
Credit Line Revolving
Create a Home Valuation Report for This Property
The Home Valuation Report is an in-depth analysis detailing your home's value as well as a comparison with similar homes in the area
Home Values in the Area
Average Home Value in this Area
Purchase History
| Date | Buyer | Sale Price | Title Company |
|---|---|---|---|
| Nguyen Charles M | -- | Wfg National Title Company | |
| Nguyen Charles M | -- | Wfg National Title Company | |
| Nguyen Johnny M | -- | First Southwestern Title Co | |
| Nguyen Charles M | $495,000 | First Southwestern Title Co |
Source: Public Records
Mortgage History
| Date | Status | Borrower | Loan Amount |
|---|---|---|---|
| Open | Nguyen Charles M | $412,000 | |
| Previous Owner | Nguyen Johnny M | $99,000 | |
| Previous Owner | Nguyen Charles M | $396,000 |
Source: Public Records
Tax History Compared to Growth
Tax History
| Year | Tax Paid | Tax Assessment Tax Assessment Total Assessment is a certain percentage of the fair market value that is determined by local assessors to be the total taxable value of land and additions on the property. | Land | Improvement |
|---|---|---|---|---|
| 2025 | $10,212 | $833,599 | $334,804 | $498,795 |
| 2024 | $10,212 | $817,255 | $328,240 | $489,015 |
| 2023 | $10,017 | $801,231 | $321,804 | $479,427 |
| 2022 | $9,556 | $785,522 | $315,495 | $470,027 |
| 2021 | $8,342 | $677,000 | $272,000 | $405,000 |
| 2019 | $7,428 | $600,000 | $241,100 | $358,900 |
| 2018 | $6,733 | $540,000 | $217,000 | $323,000 |
| 2016 | $6,331 | $511,000 | $205,000 | $306,000 |
| 2015 | $5,760 | $463,000 | $186,000 | $277,000 |
| 2014 | $5,554 | $435,000 | $175,000 | $260,000 |
Source: Public Records
Map
Nearby Homes
- 7741 Variel Ave
- 21032 Baltar St
- 21018 Lull St
- 20828 Blythe St
- 7801 Kelvin Ave
- 7830 Fairchild Ave
- 7506 Independence Ave
- 20722 Keswick St
- 7812 Fairchild Ave
- 21219 Roscoe Blvd Unit 211
- 20951 Roscoe Blvd
- 7800 Fairchild Ave
- 7447 Loma Verde Ave
- 7716 Owensmouth Ave
- 7725 Owensmouth Ave
- 20646 Hatton St
- 21050 Community St
- 20920 Community St Unit 7
- 8341 De Soto Ave Unit 10
- 20807 Roscoe Blvd Unit 1
- 7827 Variel Ave
- 7815 Variel Ave
- 7835 Variel Ave
- 7809 Variel Ave
- 21136 Ingomar St
- 21132 Ingomar St
- 21128 Ingomar St
- 21056 Elkwood St
- 7866 Deering Ave
- 7839 Variel Ave
- 7801 Variel Ave
- 21128 Ingomar Ct
- 21057 Elkwood St
- 21048 Elkwood St
- 21055 Ingomar St
- 21133 Ingomar St
- 7845 Variel Ave
- 21126 Ingomar St
- 21126 Ingomar Ct
- 21136 Ingomar Ct