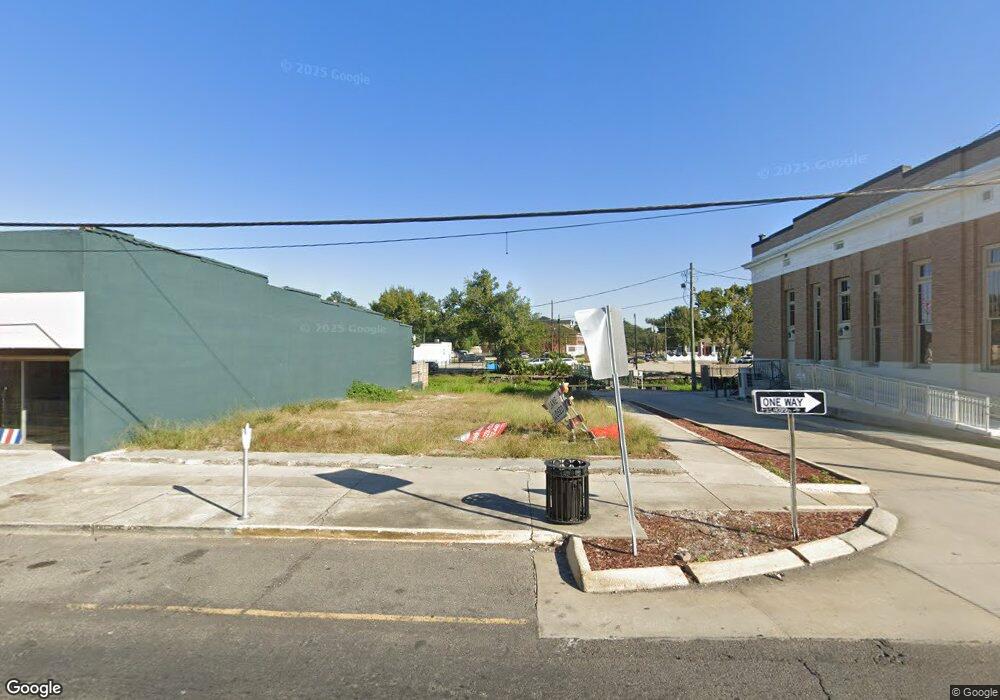
7821 W Main St Houma, LA 70360
West End NeighborhoodEstimated Value: $54,759
--
Bed
--
Bath
--
Sq Ft
4,792
Sq Ft Lot
About This Home
This home is located at 7821 W Main St, Houma, LA 70360 and is currently estimated at $54,759. 7821 W Main St is a home located in Terrebonne Parish with nearby schools including Southdown Elementary School, Houma Junior High School, and Terrebonne High School.
Ownership History
Date
Name
Owned For
Owner Type
Purchase Details
Closed on
Oct 29, 2025
Sold by
Coastal Commercial Properties Llc
Bought by
Pescado Llc
Current Estimated Value
Home Financials for this Owner
Home Financials are based on the most recent Mortgage that was taken out on this home.
Original Mortgage
$82,500
Outstanding Balance
$82,500
Interest Rate
6.26%
Mortgage Type
Credit Line Revolving
Estimated Equity
-$27,741
Purchase Details
Closed on
Jul 15, 2022
Sold by
Henry Doiron Jr James
Bought by
Coastal Commercial Properties Llc
Purchase Details
Closed on
Dec 30, 2011
Sold by
Doiron Daniel J and Doiron Trudy Samanie
Bought by
Doiron James H
Create a Home Valuation Report for This Property
The Home Valuation Report is an in-depth analysis detailing your home's value as well as a comparison with similar homes in the area
Home Values in the Area
Average Home Value in this Area
Purchase History
| Date | Buyer | Sale Price | Title Company |
|---|---|---|---|
| Pescado Llc | $110,000 | None Listed On Document | |
| Coastal Commercial Properties Llc | $60,000 | Landry Craig J | |
| Coastal Commercial Properties Llc | $60,000 | Landry Craig J | |
| Doiron James H | -- | -- |
Source: Public Records
Mortgage History
| Date | Status | Borrower | Loan Amount |
|---|---|---|---|
| Open | Pescado Llc | $82,500 |
Source: Public Records
Tax History Compared to Growth
Tax History
| Year | Tax Paid | Tax Assessment Tax Assessment Total Assessment is a certain percentage of the fair market value that is determined by local assessors to be the total taxable value of land and additions on the property. | Land | Improvement |
|---|---|---|---|---|
| 2024 | $576 | $6,160 | $6,160 | $0 |
| 2023 | $576 | $6,160 | $6,160 | $0 |
| 2022 | $1,448 | $15,960 | $6,160 | $9,800 |
| 2021 | $1,281 | $14,490 | $6,160 | $8,330 |
| 2020 | $1,356 | $15,960 | $6,160 | $9,800 |
| 2019 | $1,418 | $15,400 | $5,600 | $9,800 |
| 2018 | $1,445 | $15,400 | $5,600 | $9,800 |
| 2017 | $1,440 | $15,400 | $5,600 | $9,800 |
| 2015 | $1,126 | $14,940 | $5,335 | $9,605 |
| 2014 | $1,404 | $14,940 | $0 | $0 |
| 2013 | $1,406 | $14,940 | $0 | $0 |
Source: Public Records
Map
Nearby Homes