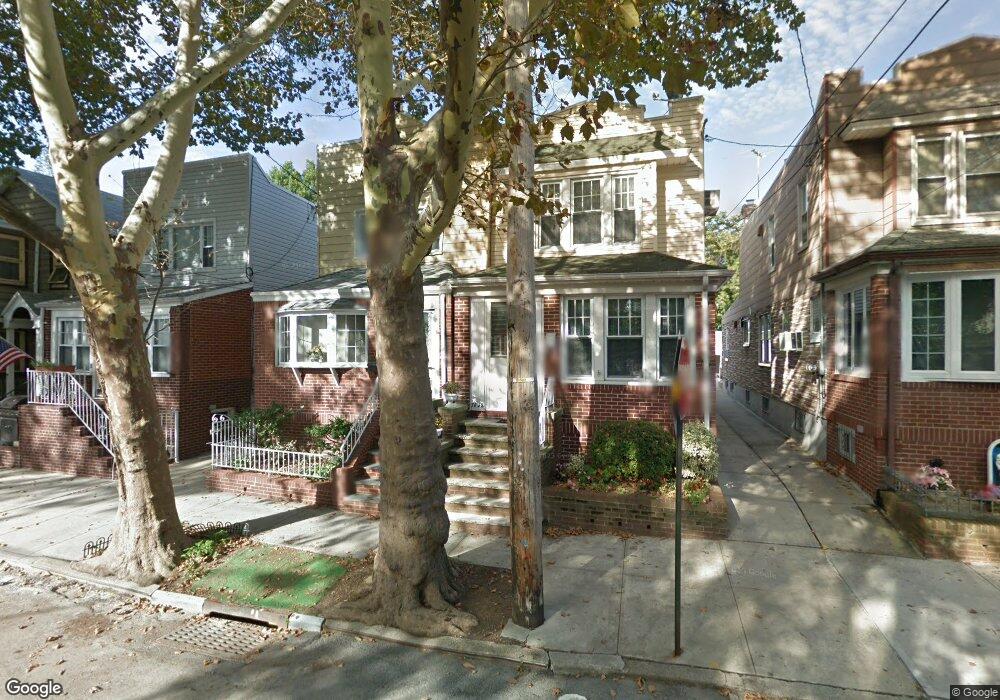
7822 79th Ln Unit 1 Glendale, NY 11385
Glendale NeighborhoodEstimated Value: $770,937 - $850,000
2
Beds
1
Bath
1,328
Sq Ft
$617/Sq Ft
Est. Value
About This Home
This home is located at 7822 79th Ln Unit 1, Glendale, NY 11385 and is currently estimated at $818,734, approximately $616 per square foot. 7822 79th Ln Unit 1 is a home located in Queens County with nearby schools including I.S. 119 the Glendale and Elm Community Charter School.
Ownership History
Date
Name
Owned For
Owner Type
Purchase Details
Closed on
Jun 27, 2016
Sold by
Pra David and Pra Kathleen
Bought by
Ruiz Leonardo and Ruiz Mayra Pelaez
Current Estimated Value
Home Financials for this Owner
Home Financials are based on the most recent Mortgage that was taken out on this home.
Original Mortgage
$574,378
Outstanding Balance
$456,123
Interest Rate
3.75%
Mortgage Type
FHA
Estimated Equity
$362,611
Create a Home Valuation Report for This Property
The Home Valuation Report is an in-depth analysis detailing your home's value as well as a comparison with similar homes in the area
Home Values in the Area
Average Home Value in this Area
Purchase History
| Date | Buyer | Sale Price | Title Company |
|---|---|---|---|
| Ruiz Leonardo | $589,000 | -- |
Source: Public Records
Mortgage History
| Date | Status | Borrower | Loan Amount |
|---|---|---|---|
| Open | Ruiz Leonardo | $574,378 |
Source: Public Records
Tax History
| Year | Tax Paid | Tax Assessment Tax Assessment Total Assessment is a certain percentage of the fair market value that is determined by local assessors to be the total taxable value of land and additions on the property. | Land | Improvement |
|---|---|---|---|---|
| 2025 | $7,276 | $38,400 | $11,944 | $26,456 |
| 2024 | $7,276 | $36,228 | $11,643 | $24,585 |
| 2023 | $6,865 | $34,180 | $11,569 | $22,611 |
| 2022 | $6,437 | $44,820 | $14,520 | $30,300 |
| 2021 | $6,786 | $40,680 | $14,520 | $26,160 |
| 2020 | $6,773 | $38,820 | $14,520 | $24,300 |
| 2019 | $6,315 | $39,720 | $14,520 | $25,200 |
| 2018 | $5,806 | $28,483 | $12,487 | $15,996 |
| 2017 | $5,178 | $26,872 | $11,041 | $15,831 |
| 2016 | $5,062 | $26,872 | $11,041 | $15,831 |
| 2015 | $2,838 | $26,667 | $14,550 | $12,117 |
| 2014 | $2,838 | $25,159 | $15,243 | $9,916 |
Source: Public Records
Map
Nearby Homes
Your Personal Tour Guide
Ask me questions while you tour the home.