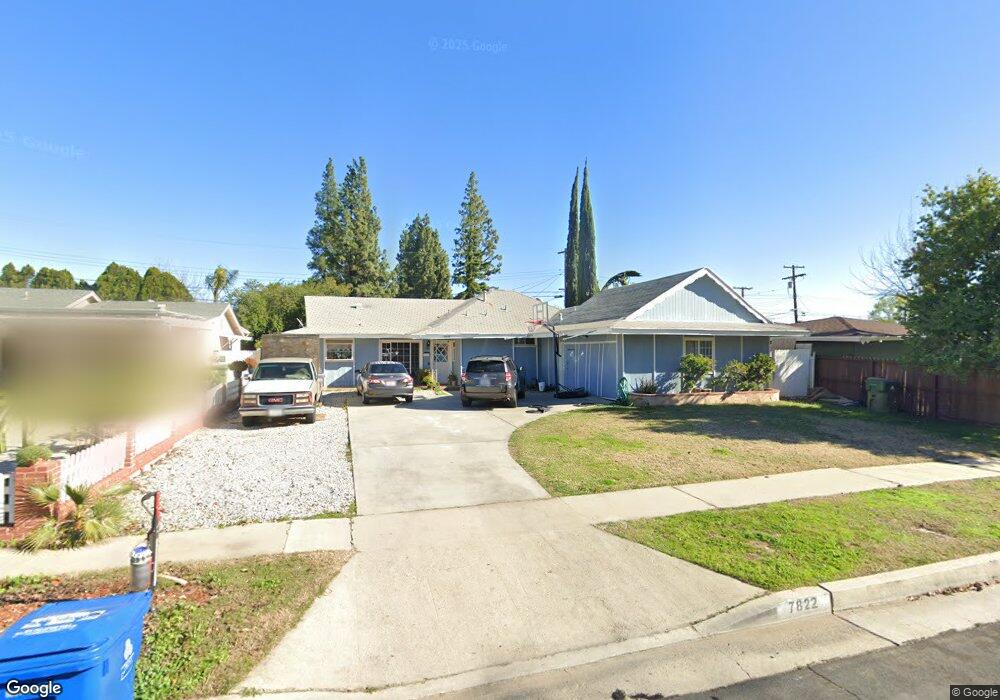
7822 Ducor Ave Canoga Park, CA 91304
Canoga Park NeighborhoodEstimated Value: $841,000 - $870,000
3
Beds
2
Baths
1,433
Sq Ft
$595/Sq Ft
Est. Value
About This Home
This home is located at 7822 Ducor Ave, Canoga Park, CA 91304 and is currently estimated at $852,858, approximately $595 per square foot. 7822 Ducor Ave is a home located in Los Angeles County with nearby schools including Christopher Columbus Middle School, Canoga Park Senior High School, and Justice Street Academy Charter.
Ownership History
Date
Name
Owned For
Owner Type
Purchase Details
Closed on
Jun 5, 2008
Sold by
Rodriguez Manfred
Bought by
Rodriguez Manfred
Current Estimated Value
Home Financials for this Owner
Home Financials are based on the most recent Mortgage that was taken out on this home.
Original Mortgage
$320,000
Outstanding Balance
$205,343
Interest Rate
6.05%
Mortgage Type
New Conventional
Estimated Equity
$647,515
Purchase Details
Closed on
Jun 19, 1996
Sold by
Mere Chet Le
Bought by
Rodriguez Manfred
Home Financials for this Owner
Home Financials are based on the most recent Mortgage that was taken out on this home.
Original Mortgage
$145,348
Interest Rate
8.42%
Mortgage Type
FHA
Purchase Details
Closed on
Dec 13, 1993
Sold by
Lemere Chet H
Bought by
Lemere Chet H
Home Financials for this Owner
Home Financials are based on the most recent Mortgage that was taken out on this home.
Original Mortgage
$115,000
Interest Rate
8.95%
Create a Home Valuation Report for This Property
The Home Valuation Report is an in-depth analysis detailing your home's value as well as a comparison with similar homes in the area
Home Values in the Area
Average Home Value in this Area
Purchase History
| Date | Buyer | Sale Price | Title Company |
|---|---|---|---|
| Rodriguez Manfred | -- | United Title Company | |
| Rodriguez Manfred | $148,000 | Chicago Title | |
| Lemere Chet H | -- | Stewart Title Company |
Source: Public Records
Mortgage History
| Date | Status | Borrower | Loan Amount |
|---|---|---|---|
| Open | Rodriguez Manfred | $320,000 | |
| Previous Owner | Rodriguez Manfred | $145,348 | |
| Previous Owner | Lemere Chet H | $115,000 |
Source: Public Records
Tax History Compared to Growth
Tax History
| Year | Tax Paid | Tax Assessment Tax Assessment Total Assessment is a certain percentage of the fair market value that is determined by local assessors to be the total taxable value of land and additions on the property. | Land | Improvement |
|---|---|---|---|---|
| 2025 | $3,242 | $241,017 | $149,337 | $91,680 |
| 2024 | $3,242 | $236,292 | $146,409 | $89,883 |
| 2023 | $3,186 | $231,660 | $143,539 | $88,121 |
| 2022 | $3,049 | $227,119 | $140,725 | $86,394 |
| 2021 | $3,008 | $222,666 | $137,966 | $84,700 |
| 2019 | $2,925 | $216,064 | $133,875 | $82,189 |
| 2018 | $2,788 | $211,828 | $131,250 | $80,578 |
| 2016 | $2,656 | $203,604 | $126,154 | $77,450 |
| 2015 | $2,619 | $200,547 | $124,260 | $76,287 |
| 2014 | $2,637 | $196,619 | $121,826 | $74,793 |
Source: Public Records
Map
Nearby Homes
- 7925 Royer Ave
- 7729 Sedan Ave
- 7932 Woodlake Ave
- 23200 Justice St
- 8108 Royer Ave
- 22906 Lanark St
- 7635 Fallbrook Ave
- 23025 Covello St
- 22715 Keswick St
- 8208 Fallbrook Ave
- 8225 Fallbrook Ave
- 22700 Baltar St
- 22836 Covello St
- 7446 Woodlake Ave
- 7435 Lena Ave
- 8324 Joan Ln
- 7442 Bobbyboyar Ave
- 8373 Denise Ln
- 7556 Chaminade Ave
- 22637 Covello St
- 7816 Ducor Ave
- 7830 Ducor Ave
- 23021 Elkwood St
- 23020 Elkwood St
- 7838 Ducor Ave
- 7808 Ducor Ave
- 7823 Ducor Ave
- 7831 Ducor Ave
- 7817 Ducor Ave
- 23015 Elkwood St
- 23016 Elkwood St
- 7844 Ducor Ave
- 23031 Ingomar St
- 7839 Ducor Ave
- 7809 Ducor Ave
- 23023 Ingomar St
- 23020 Arminta St
- 23016 Arminta St
- 23009 Elkwood St
- 23008 Elkwood St