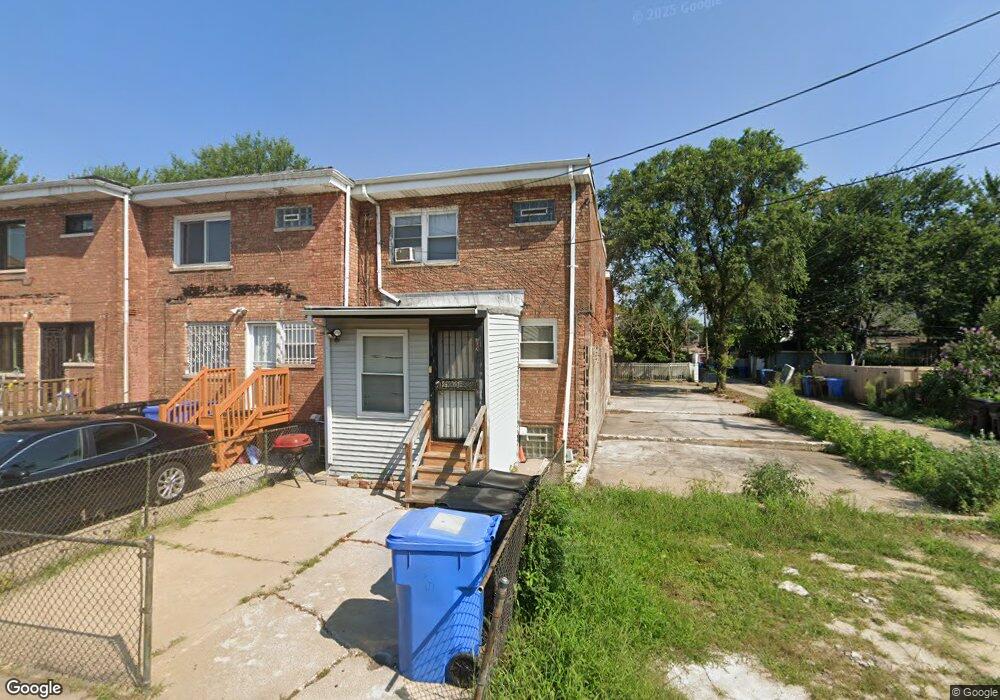
7823 S Jeffery Blvd Chicago, IL 60649
South Shore NeighborhoodEstimated Value: $114,000 - $151,000
3
Beds
2
Baths
1,080
Sq Ft
$122/Sq Ft
Est. Value
About This Home
This home is located at 7823 S Jeffery Blvd, Chicago, IL 60649 and is currently estimated at $132,261, approximately $122 per square foot. 7823 S Jeffery Blvd is a home located in Cook County with nearby schools including Mann Elementary School, St Paul Lutheran School, and Muhammad University.
Ownership History
Date
Name
Owned For
Owner Type
Purchase Details
Closed on
Feb 5, 2009
Sold by
Deutsche Bank National Trust Company
Bought by
Quadri Syed N and Quadri Farzana
Current Estimated Value
Purchase Details
Closed on
Apr 4, 2008
Sold by
Mcgee Smith
Bought by
Deutsche Bank National Trust Co and Ameriquest Mortgage Securities Inc Asset
Purchase Details
Closed on
Jun 28, 2005
Sold by
Smith Glenda D
Bought by
Smith Mcgee Glenda D
Home Financials for this Owner
Home Financials are based on the most recent Mortgage that was taken out on this home.
Original Mortgage
$125,100
Interest Rate
5.69%
Mortgage Type
Fannie Mae Freddie Mac
Purchase Details
Closed on
Aug 17, 1993
Sold by
Sheahan Michael F
Bought by
Seaway National Bank
Purchase Details
Closed on
Feb 11, 1993
Sold by
Seaway National Bank
Bought by
Smith Glenda D
Home Financials for this Owner
Home Financials are based on the most recent Mortgage that was taken out on this home.
Original Mortgage
$30,400
Interest Rate
7.05%
Create a Home Valuation Report for This Property
The Home Valuation Report is an in-depth analysis detailing your home's value as well as a comparison with similar homes in the area
Home Values in the Area
Average Home Value in this Area
Purchase History
| Date | Buyer | Sale Price | Title Company |
|---|---|---|---|
| Quadri Syed N | $20,000 | Wheatland Title Guaranty | |
| Deutsche Bank National Trust Co | -- | None Available | |
| Smith Mcgee Glenda D | -- | Tristar Title Llc | |
| Seaway National Bank | -- | -- | |
| Smith Glenda D | $21,333 | -- |
Source: Public Records
Mortgage History
| Date | Status | Borrower | Loan Amount |
|---|---|---|---|
| Previous Owner | Smith Mcgee Glenda D | $125,100 | |
| Previous Owner | Smith Glenda D | $30,400 |
Source: Public Records
Tax History Compared to Growth
Tax History
| Year | Tax Paid | Tax Assessment Tax Assessment Total Assessment is a certain percentage of the fair market value that is determined by local assessors to be the total taxable value of land and additions on the property. | Land | Improvement |
|---|---|---|---|---|
| 2024 | $1,270 | $7,800 | $1,575 | $6,225 |
| 2023 | $1,234 | $6,000 | $1,575 | $4,425 |
| 2022 | $1,234 | $6,000 | $1,575 | $4,425 |
| 2021 | $1,207 | $6,000 | $1,575 | $4,425 |
| 2020 | $1,973 | $8,856 | $1,134 | $7,722 |
| 2019 | $1,977 | $9,841 | $1,134 | $8,707 |
| 2018 | $1,944 | $9,841 | $1,134 | $8,707 |
| 2017 | $1,977 | $9,184 | $1,008 | $8,176 |
| 2016 | $1,839 | $9,184 | $1,008 | $8,176 |
| 2015 | $1,683 | $9,184 | $1,008 | $8,176 |
| 2014 | $1,270 | $6,845 | $882 | $5,963 |
| 2013 | $1,245 | $6,845 | $882 | $5,963 |
Source: Public Records
Map
Nearby Homes
- 7816 S Jeffery Blvd
- 7828 S Jeffery Blvd
- 7844 S Jeffery Blvd
- 7847 S Bennett Ave
- 7718 S Jeffery Blvd Unit GN
- 7724 S Chappel Ave
- 7846 S Bennett Ave
- 7759 S Constance Ave
- 7741 S Clyde Ave
- 7830 S Merrill Ave
- 7943 S Bennett Ave
- 7955 S Chappel Ave
- 7947 S Clyde Ave
- 8014 S Jeffery Blvd
- 1758 E 79th St
- 7959 S Constance Ave
- 7642 S Merrill Ave
- 7621 S Clyde Ave
- 7723 S Paxton Ave
- 7650 S Cregier Ave
- 7823 S Jeffery Blvd
- 7823 S Jeffery Blvd Unit 7823
- 7825 S Jeffery Blvd
- 7827 S Jeffery Blvd
- 7829 S Jeffery Blvd
- 7829 S Jeffery Blvd
- 7821 S Jeffery Blvd
- 7821 S Jeffery Blvd
- 7819 S Jeffery Blvd
- 7831 S Jeffery Blvd
- 7831 S Jeffery Blvd
- 7831 S Jeffery Blvd
- 7817 S Jeffery Blvd
- 7815 S Jeffery Blvd
- 7813 S Jeffery Blvd
- 7813 S Jeffery Blvd
- 7813 S Jeffery Blvd
- 7822 S Chappel Ave
- 7820 S Chappel Ave
- 7816 S Chappel Ave