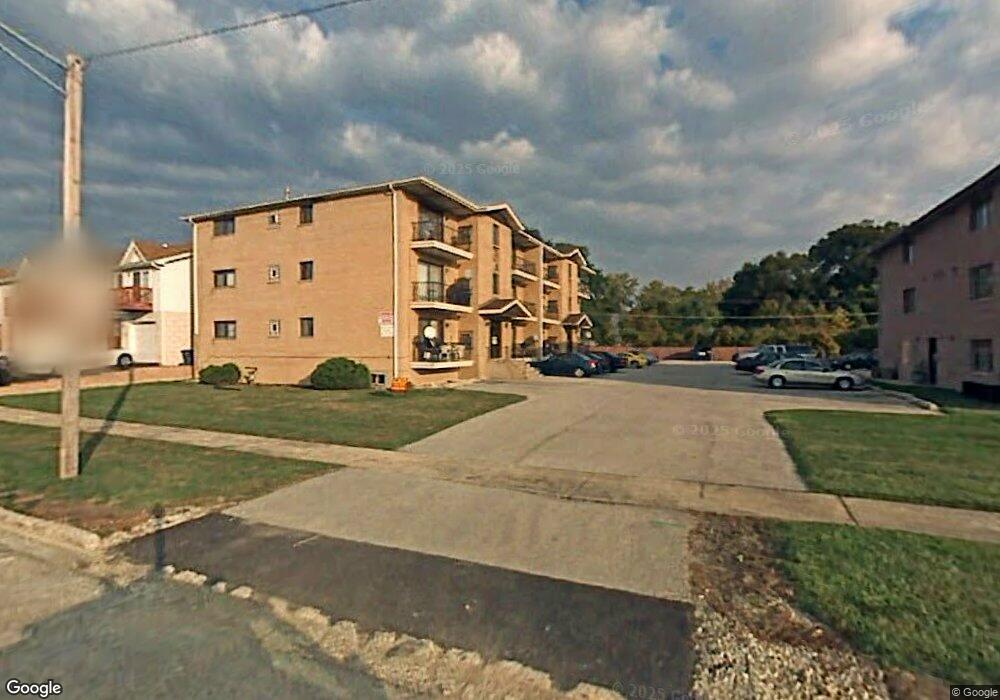
7824 W 87th Place Unit 1 Bridgeview, IL 60455
Little Palestine NeighborhoodEstimated Value: $193,000 - $237,000
2
Beds
2
Baths
1,000
Sq Ft
$209/Sq Ft
Est. Value
About This Home
This home is located at 7824 W 87th Place Unit 1, Bridgeview, IL 60455 and is currently estimated at $208,691, approximately $208 per square foot. 7824 W 87th Place Unit 1 is a home located in Cook County with nearby schools including Dorn Elementary School, Glen Oaks Elementary School, and H H Conrady Jr High School.
Ownership History
Date
Name
Owned For
Owner Type
Purchase Details
Closed on
Nov 15, 2021
Sold by
Schindler Leonard
Bought by
Miller Krysten
Current Estimated Value
Home Financials for this Owner
Home Financials are based on the most recent Mortgage that was taken out on this home.
Original Mortgage
$147,250
Outstanding Balance
$135,116
Interest Rate
3.09%
Mortgage Type
New Conventional
Estimated Equity
$73,575
Purchase Details
Closed on
Apr 21, 2017
Sold by
Hudec David A and Hudec Denise A
Bought by
Schindler Leonard L
Home Financials for this Owner
Home Financials are based on the most recent Mortgage that was taken out on this home.
Original Mortgage
$50,000
Interest Rate
4.3%
Mortgage Type
Commercial
Purchase Details
Closed on
Sep 30, 2004
Sold by
Wesolek Christine
Bought by
Hudec David A
Home Financials for this Owner
Home Financials are based on the most recent Mortgage that was taken out on this home.
Original Mortgage
$110,675
Interest Rate
5.93%
Mortgage Type
Unknown
Create a Home Valuation Report for This Property
The Home Valuation Report is an in-depth analysis detailing your home's value as well as a comparison with similar homes in the area
Home Values in the Area
Average Home Value in this Area
Purchase History
| Date | Buyer | Sale Price | Title Company |
|---|---|---|---|
| Miller Krysten | $155,000 | Affinity Title Services Llc | |
| Schindler Leonard L | $97,500 | Attorney | |
| Hudec David A | $116,500 | Cst |
Source: Public Records
Mortgage History
| Date | Status | Borrower | Loan Amount |
|---|---|---|---|
| Open | Miller Krysten | $147,250 | |
| Previous Owner | Schindler Leonard L | $50,000 | |
| Previous Owner | Hudec David A | $110,675 |
Source: Public Records
Tax History Compared to Growth
Tax History
| Year | Tax Paid | Tax Assessment Tax Assessment Total Assessment is a certain percentage of the fair market value that is determined by local assessors to be the total taxable value of land and additions on the property. | Land | Improvement |
|---|---|---|---|---|
| 2024 | $3,353 | $13,828 | $1,236 | $12,592 |
| 2023 | $2,767 | $13,828 | $1,236 | $12,592 |
| 2022 | $2,767 | $10,489 | $839 | $9,650 |
| 2021 | $4,017 | $10,487 | $838 | $9,649 |
| 2020 | $3,952 | $10,487 | $838 | $9,649 |
| 2019 | $3,906 | $10,096 | $750 | $9,346 |
| 2018 | $3,816 | $10,096 | $750 | $9,346 |
| 2017 | $4,148 | $14,885 | $750 | $14,135 |
| 2016 | $2,379 | $8,626 | $662 | $7,964 |
| 2015 | $2,215 | $8,626 | $662 | $7,964 |
| 2014 | $2,167 | $8,626 | $662 | $7,964 |
| 2013 | $2,622 | $10,582 | $662 | $9,920 |
Source: Public Records
Map
Nearby Homes
- 8332 S 77th Ct
- 8545 S Roberts Rd
- 9003 Milford Ct
- 9051 S Roberts Rd Unit 310
- 8800 S Harlem Ave Unit 19
- 8800 S Harlem Ave Unit 2311
- 8800 S Harlem Ave Unit 2111
- 8800 S Harlem Ave
- 8142 W 90th St
- 8332 S 78th Ct
- 8059 W 84th St Unit 3N
- 8059 W 84th St Unit 3S
- 8302 W 87th St
- 8543 S 83rd Ave
- 7806 W 83rd St
- 8564 S 83rd Ave
- 7345 W 85th Place Unit 3A
- 7336 W 86th St Unit 2B
- 8931 S 83rd Ct
- 8232 S Ferdinand Ave
- 7824 W 87th Place Unit 2D
- 7824 W 87th Place Unit 3A
- 7824 W 87th Place Unit 3
- 7824 W 87th Place Unit 2
- 7824 W 87th Place Unit 1
- 7824 W 87th Place Unit 2
- 7824 W 87th Place Unit 3
- 7824 W 87th Place Unit 2
- 7824 W 87th Place Unit 1
- 7824 W 87th Place Unit 3
- 7824 W 87th Place Unit 2
- 7824 W 87th Place Unit 3
- 7824 W 87th Place Unit 3C
- 7824 W 87th Place Unit 2A
- 7824 W 87th Place Unit 1C
- 7828 W 87th Place
- 7832 W 87th Place Unit B
- 7832 W 87th Place
- 7836 W 87th Place Unit C
- 7836 W 87th Place