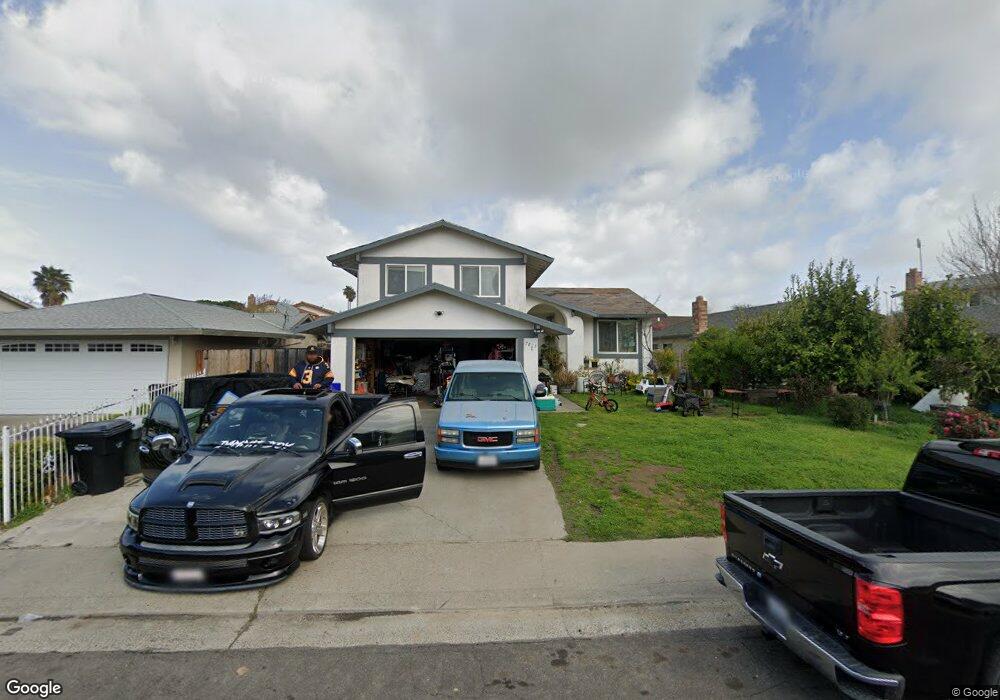
7825 Skander Way Sacramento, CA 95828
Estimated Value: $240,000 - $478,000
4
Beds
3
Baths
1,810
Sq Ft
$227/Sq Ft
Est. Value
About This Home
This home is located at 7825 Skander Way, Sacramento, CA 95828 and is currently estimated at $410,286, approximately $226 per square foot. 7825 Skander Way is a home located in Sacramento County with nearby schools including David Reese Elementary School, James Rutter Middle School, and Florin High School.
Ownership History
Date
Name
Owned For
Owner Type
Purchase Details
Closed on
Jun 21, 2013
Sold by
Yeakle Daryl
Bought by
Yeakle Daryl
Current Estimated Value
Home Financials for this Owner
Home Financials are based on the most recent Mortgage that was taken out on this home.
Original Mortgage
$106,000
Interest Rate
3.88%
Mortgage Type
New Conventional
Purchase Details
Closed on
Oct 10, 2008
Sold by
United States Of America
Bought by
Yeakle Daryl and Yeakle Tracy
Purchase Details
Closed on
Aug 2, 1995
Sold by
Federal Home Loan Mortgage Corporation
Bought by
Luong Huy Chi
Home Financials for this Owner
Home Financials are based on the most recent Mortgage that was taken out on this home.
Original Mortgage
$35,000
Interest Rate
7.61%
Purchase Details
Closed on
Apr 21, 1995
Sold by
Keil Gerald R and Keil Rebecca M
Bought by
Federal Home Loan Mortgage Corporation
Create a Home Valuation Report for This Property
The Home Valuation Report is an in-depth analysis detailing your home's value as well as a comparison with similar homes in the area
Home Values in the Area
Average Home Value in this Area
Purchase History
| Date | Buyer | Sale Price | Title Company |
|---|---|---|---|
| Yeakle Daryl | -- | First American Title | |
| Yeakle Daryl | $110,000 | Lsi Title Company Ca | |
| Luong Huy Chi | $103,500 | First American Title Ins Co | |
| Federal Home Loan Mortgage Corporation | $105,000 | Fidelity National Title Ins |
Source: Public Records
Mortgage History
| Date | Status | Borrower | Loan Amount |
|---|---|---|---|
| Closed | Yeakle Daryl | $106,000 | |
| Previous Owner | Luong Huy Chi | $35,000 |
Source: Public Records
Tax History Compared to Growth
Tax History
| Year | Tax Paid | Tax Assessment Tax Assessment Total Assessment is a certain percentage of the fair market value that is determined by local assessors to be the total taxable value of land and additions on the property. | Land | Improvement |
|---|---|---|---|---|
| 2025 | $1,559 | $141,503 | $25,745 | $115,758 |
| 2024 | $1,559 | $138,730 | $25,241 | $113,489 |
| 2023 | $1,520 | $136,011 | $24,747 | $111,264 |
| 2022 | $1,495 | $133,345 | $24,262 | $109,083 |
| 2021 | $1,478 | $130,732 | $23,787 | $106,945 |
| 2020 | $1,459 | $129,393 | $23,544 | $105,849 |
| 2019 | $1,433 | $126,857 | $23,083 | $103,774 |
| 2018 | $1,395 | $124,371 | $22,631 | $101,740 |
| 2017 | $1,371 | $121,934 | $22,188 | $99,746 |
| 2016 | $1,303 | $119,544 | $21,753 | $97,791 |
| 2015 | $1,279 | $117,750 | $21,427 | $96,323 |
| 2014 | $1,258 | $115,445 | $21,008 | $94,437 |
Source: Public Records
Map
Nearby Homes
- 7825 Rockhurst Way
- 7467 Power Inn Rd
- 7600 Clement Cir
- 7633 Clement Cir
- 7413 Skander Way
- 7551 Red Bud Ln
- 7442 Della Cir
- 7605 Mctavish Cir
- 7548 Huckleberry Ln
- 7604 Loucreta Dr
- 7451 Albezzia Ln
- 7309 Power Inn Rd
- 8214 Moorhaven Way
- 7625 Par Pkwy
- 8205 White Sands Way
- 8200 Cottonfield Way
- 8207 Wildfire Ln
- 7206 Willowwest Ct
- 8212 Coed Ln
- 7313 Sunshire Ln
- 7829 Skander Way
- 7821 Skander Way
- 7900 Camrose Way
- 7901 Skander Way
- 7817 Skander Way
- 7820 Camrose Way
- 7904 Camrose Way
- 7824 Skander Way
- 7908 Camrose Way
- 7816 Camrose Way
- 7828 Skander Way
- 7905 Skander Way
- 7820 Skander Way
- 7813 Skander Way
- 7900 Skander Way
- 7816 Skander Way
- 7912 Camrose Way
- 7812 Camrose Way
- 7904 Skander Way
- 7909 Skander Way