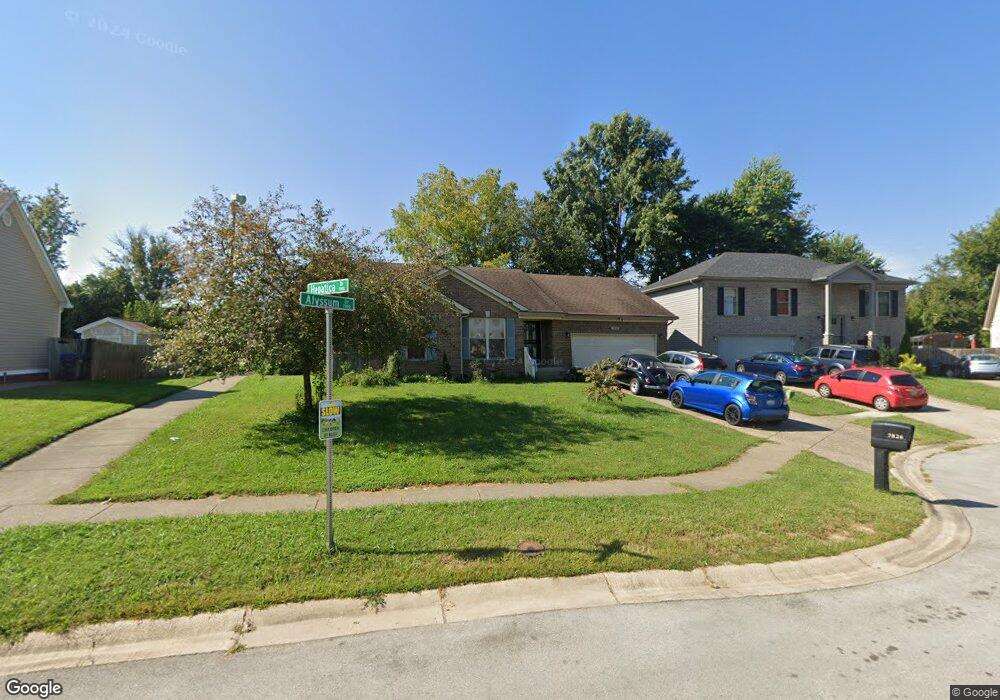
7826 Hepatica Dr Unit L 24 Louisville, KY 40258
Pleasure Ridge Park NeighborhoodEstimated Value: $256,076 - $317,000
3
Beds
2
Baths
1,260
Sq Ft
$230/Sq Ft
Est. Value
About This Home
This home is located at 7826 Hepatica Dr Unit L 24, Louisville, KY 40258 and is currently estimated at $289,519, approximately $229 per square foot. 7826 Hepatica Dr Unit L 24 is a home located in Jefferson County with nearby schools including Shacklette Elementary School, Wilkerson Elementary School, and Greenwood Elementary School.
Ownership History
Date
Name
Owned For
Owner Type
Purchase Details
Closed on
Oct 25, 2017
Sold by
Hundley Mary and Hundley Mary Elizabeth
Bought by
Hundley Ronnie Lee and Hundley Mary Elizabeth
Current Estimated Value
Home Financials for this Owner
Home Financials are based on the most recent Mortgage that was taken out on this home.
Original Mortgage
$152,116
Outstanding Balance
$126,181
Interest Rate
4.2%
Mortgage Type
FHA
Estimated Equity
$163,339
Purchase Details
Closed on
Feb 23, 2016
Sold by
Hundley Mary and Morris Mary
Bought by
Hundley Mary
Home Financials for this Owner
Home Financials are based on the most recent Mortgage that was taken out on this home.
Original Mortgage
$132,275
Interest Rate
3.73%
Mortgage Type
FHA
Purchase Details
Closed on
Jul 5, 2005
Sold by
New Horizon Investments Llc
Bought by
Morris William and Morris Mary
Purchase Details
Closed on
Mar 25, 2005
Sold by
The Housing Partnership Inc
Bought by
Hughes Tawana
Create a Home Valuation Report for This Property
The Home Valuation Report is an in-depth analysis detailing your home's value as well as a comparison with similar homes in the area
Home Values in the Area
Average Home Value in this Area
Purchase History
| Date | Buyer | Sale Price | Title Company |
|---|---|---|---|
| Hundley Ronnie Lee | -- | Commonwealth Usa Settlements | |
| Hundley Mary | -- | None Available | |
| Morris William | $156,000 | None Available | |
| Hughes Tawana | $23,800 | Agency Title |
Source: Public Records
Mortgage History
| Date | Status | Borrower | Loan Amount |
|---|---|---|---|
| Open | Hundley Ronnie Lee | $152,116 | |
| Closed | Hundley Mary | $132,275 |
Source: Public Records
Tax History Compared to Growth
Tax History
| Year | Tax Paid | Tax Assessment Tax Assessment Total Assessment is a certain percentage of the fair market value that is determined by local assessors to be the total taxable value of land and additions on the property. | Land | Improvement |
|---|---|---|---|---|
| 2024 | $2,689 | $230,820 | $25,000 | $205,820 |
| 2023 | $2,765 | $230,820 | $25,000 | $205,820 |
| 2022 | $2,078 | $172,840 | $25,000 | $147,840 |
| 2021 | $2,238 | $172,840 | $25,000 | $147,840 |
| 2020 | $2,000 | $172,840 | $25,000 | $147,840 |
| 2019 | $1,960 | $172,840 | $25,000 | $147,840 |
| 2018 | $1,869 | $166,780 | $30,090 | $136,690 |
| 2017 | $1,750 | $166,780 | $30,090 | $136,690 |
| 2013 | $1,668 | $166,780 | $30,090 | $136,690 |
Source: Public Records
Map
Nearby Homes
- 5406 Trefoil Ln
- 5215 Pyrus Ln
- 7711 Bramble Ln
- 7801 Mango Dr
- 8108 Nancy Ln
- 5007 Lila Ave
- 7906 Daffodil Dr
- 5006 Tumeric Ln
- 5011 Paramount Dr
- 5513 Tamarack Ln
- 5605 Tamarack Ln
- 7807 Axtell Ave
- 5202 Rodgers Rd
- 5008 Greenwood Rd
- 5901 Jessamine Ln
- 8208 Kerry Rd
- 7903 Columbine Dr
- 7228 Daisy Ave
- 5212 W Pages Ln
- 8008 Columbine Dr
- 7826 Hepatica Dr
- 7824 Hepatica Dr
- 7829 Alyssum Dr
- 7822 Hepatica Dr
- 7827 Alyssum Dr
- 7820 Hepatica Dr
- 7820 Hepatica Dr Unit L 27
- 7823 Hepatica Dr
- 7818 Hepatica Dr
- 7825 Alyssum Dr
- 5401 Jessamine Ln
- 7909 Bramble Ln
- 7817 Hepatica Dr
- 7817 Hepatica Dr Unit (L 56)
- 7816 Hepatica Dr
- 7907 Bramble Ln
- 7818 Alyssum Dr
- 7818 Alyssum Dr Unit L 59
- 7823 Alyssum Dr
- 7823 Alyssum Dr Unit LOT 20