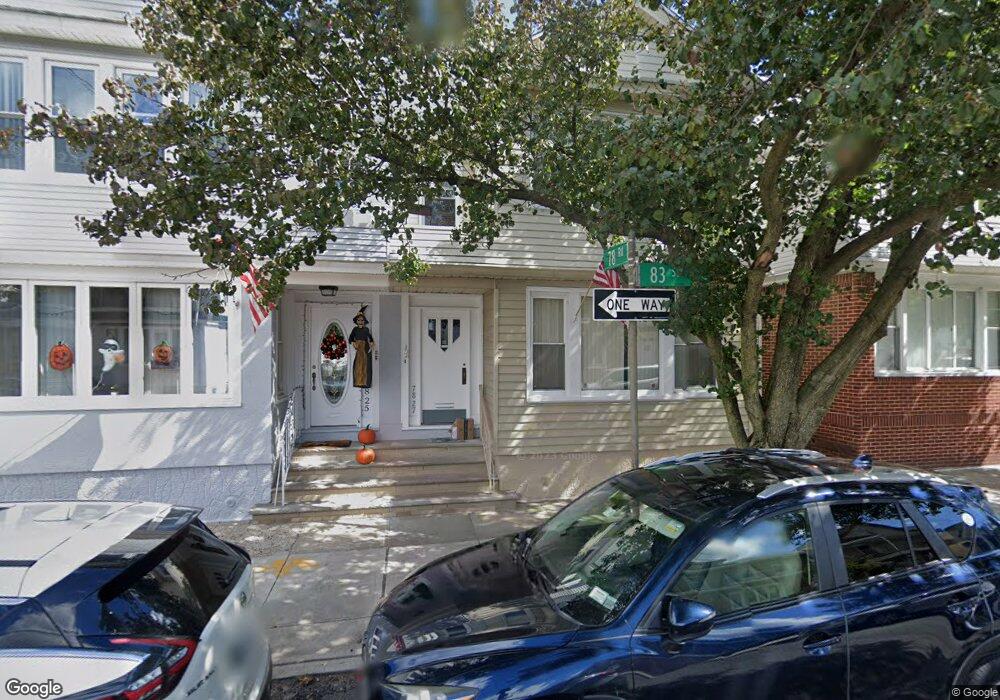
7827 83rd St Glendale, NY 11385
Glendale NeighborhoodEstimated Value: $917,340 - $1,147,000
2
Beds
1
Bath
1,150
Sq Ft
$881/Sq Ft
Est. Value
About This Home
This home is located at 7827 83rd St, Glendale, NY 11385 and is currently estimated at $1,013,585, approximately $881 per square foot. 7827 83rd St is a home located in Queens County with nearby schools including P.S./I.S. 113 Anthony J. Pranzo School, Queens Metropolitan High School, and Elm Community Charter School.
Ownership History
Date
Name
Owned For
Owner Type
Purchase Details
Closed on
Feb 4, 2022
Sold by
Femenella As Heir Richard L and Femenella As Heir Robert
Bought by
Ibrahim Magdy
Current Estimated Value
Home Financials for this Owner
Home Financials are based on the most recent Mortgage that was taken out on this home.
Original Mortgage
$570,000
Outstanding Balance
$529,288
Interest Rate
3.55%
Mortgage Type
Purchase Money Mortgage
Estimated Equity
$484,297
Purchase Details
Closed on
Mar 13, 2010
Sold by
Menendez Louis
Bought by
Femenella Maria and Femenella Vincent George
Create a Home Valuation Report for This Property
The Home Valuation Report is an in-depth analysis detailing your home's value as well as a comparison with similar homes in the area
Home Values in the Area
Average Home Value in this Area
Purchase History
| Date | Buyer | Sale Price | Title Company |
|---|---|---|---|
| Ibrahim Magdy | $900,000 | -- | |
| Femenella Maria | -- | -- |
Source: Public Records
Mortgage History
| Date | Status | Borrower | Loan Amount |
|---|---|---|---|
| Open | Ibrahim Magdy | $570,000 |
Source: Public Records
Tax History
| Year | Tax Paid | Tax Assessment Tax Assessment Total Assessment is a certain percentage of the fair market value that is determined by local assessors to be the total taxable value of land and additions on the property. | Land | Improvement |
|---|---|---|---|---|
| 2025 | $8,684 | $43,236 | $12,761 | $30,475 |
| 2024 | $8,684 | $43,236 | $11,982 | $31,254 |
| 2023 | $8,618 | $42,906 | $12,162 | $30,744 |
| 2022 | $8,081 | $55,440 | $17,160 | $38,280 |
| 2021 | $7,135 | $57,960 | $17,160 | $40,800 |
| 2020 | $6,721 | $55,980 | $17,160 | $38,820 |
| 2019 | $6,642 | $49,740 | $17,160 | $32,580 |
| 2018 | $6,404 | $35,755 | $13,263 | $22,492 |
| 2017 | $6,224 | $33,732 | $12,897 | $20,835 |
| 2016 | $5,702 | $33,732 | $12,897 | $20,835 |
| 2015 | $3,413 | $30,025 | $13,918 | $16,107 |
| 2014 | $3,413 | $30,025 | $15,627 | $14,398 |
Source: Public Records
Map
Nearby Homes
Your Personal Tour Guide
Ask me questions while you tour the home.