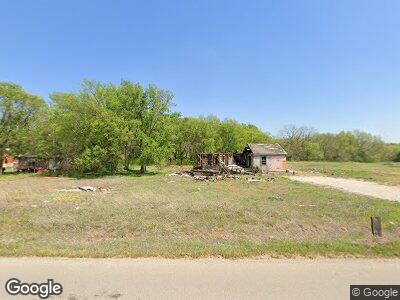
7827 Acme Rd Shawnee, OK 74804
Estimated Value: $108,508 - $171,000
2
Beds
1
Bath
974
Sq Ft
$148/Sq Ft
Est. Value
About This Home
This home is located at 7827 Acme Rd, Shawnee, OK 74804 and is currently estimated at $144,127, approximately $147 per square foot. 7827 Acme Rd is a home located in Pottawatomie County with nearby schools including Dale Elementary School, Dale Middle School, and Dale High School.
Ownership History
Date
Name
Owned For
Owner Type
Purchase Details
Closed on
Oct 5, 2022
Sold by
Perkins Christopher P
Bought by
Mcclure Tammy D
Current Estimated Value
Purchase Details
Closed on
Jul 19, 2019
Sold by
Peskins Naydene
Bought by
Perkins Christoper
Purchase Details
Closed on
Jun 18, 2018
Sold by
Perkins Christopher
Bought by
Perkins Naydene
Purchase Details
Closed on
Apr 25, 2018
Sold by
Perkins Christpher and Perkins May Lee
Bought by
Perkins Christopher Price
Purchase Details
Closed on
Mar 10, 2017
Sold by
Perkins Christopher Price and Perkins Amy Lee
Bought by
Perkins Jake M and Perkins Joshua M
Purchase Details
Closed on
Jul 26, 2002
Sold by
Graham Karen and Graham Joseph
Bought by
Perkins Thomas and Perkins Naydene
Purchase Details
Closed on
Nov 18, 1992
Sold by
Webb Investors Inc
Bought by
Paul Milburn
Purchase Details
Closed on
Oct 2, 1991
Sold by
Judd Leslie and Judd Betty
Bought by
Webb Investors Inc
Create a Home Valuation Report for This Property
The Home Valuation Report is an in-depth analysis detailing your home's value as well as a comparison with similar homes in the area
Home Values in the Area
Average Home Value in this Area
Purchase History
| Date | Buyer | Sale Price | Title Company |
|---|---|---|---|
| Mcclure Tammy D | -- | -- | |
| Perkins Christoper | -- | None Available | |
| Perkins Naydene | -- | None Available | |
| Perkins Christopher Price | -- | None Available | |
| Perkins Jake M | -- | None Available | |
| Perkins Thomas | $40,000 | -- | |
| Paul Milburn | -- | -- | |
| Webb Investors Inc | -- | -- |
Source: Public Records
Tax History Compared to Growth
Tax History
| Year | Tax Paid | Tax Assessment Tax Assessment Total Assessment is a certain percentage of the fair market value that is determined by local assessors to be the total taxable value of land and additions on the property. | Land | Improvement |
|---|---|---|---|---|
| 2024 | $980 | $1,800 | $1,800 | -- |
| 2023 | $980 | $8,644 | $1,800 | $6,844 |
| 2022 | $645 | $6,281 | $1,281 | $5,000 |
| 2021 | $674 | $6,281 | $1,281 | $5,000 |
| 2020 | $642 | $5,698 | $1,153 | $4,545 |
| 2019 | $518 | $5,427 | $1,068 | $4,359 |
| 2018 | $494 | $5,269 | $1,037 | $4,232 |
| 2017 | $460 | $5,115 | $1,002 | $4,113 |
| 2016 | $388 | $4,966 | $987 | $3,979 |
| 2015 | $363 | $4,822 | $855 | $3,967 |
| 2014 | $363 | $4,681 | $886 | $3,795 |
Source: Public Records
Map
Nearby Homes
- 38795 Garrett's Lake Rd
- 39909 Demoy Dr
- 8157 Hunter Ct
- 0 Coker Rd
- 43067 Wagon Trail
- 43068 Wagon Trail
- 40202 Moccasin Trail
- 7300 N Kickapoo Ave
- 42501 Garrett's Lake Rd
- 6 Garrett's Lake Rd
- 42847 Garrett's Lake Rd
- 42797 Garrett's Lake Rd
- 42905 Garrett's Lake Rd
- 42883 Garrett's Lake Rd
- 42865 Garrett's Lake Rd
- 9826 Wildflower Dr
- 0 58 47 Acres Garretts Lake Rd
- 6011 N Kickapoo Ave
- 40917 Shawnee Meadow Dr
- 6211 Buckhorn Trail
- 7827 Acme Rd
- 7701 Acme Rd Unit A
- 7701 Acme Rd
- 103 Valley View Dr
- 7833 Valley View Dr
- 105 Valley View Dr
- 102 Valley View Dr
- 104 Valley View Dr
- 107 Valley View Dr
- 109 Valley View Dr
- 106 Valley View Dr
- 7400 Acme Rd
- 110 Valley View Dr
- 7350 Acme Rd
- 112 Valley View Dr
- 38801 Wolverine Rd
- 39103 Wolverine Rd
- 7250 Acme Rd
- 43300 Wolverine Rd
- 00 Wolverine Rd