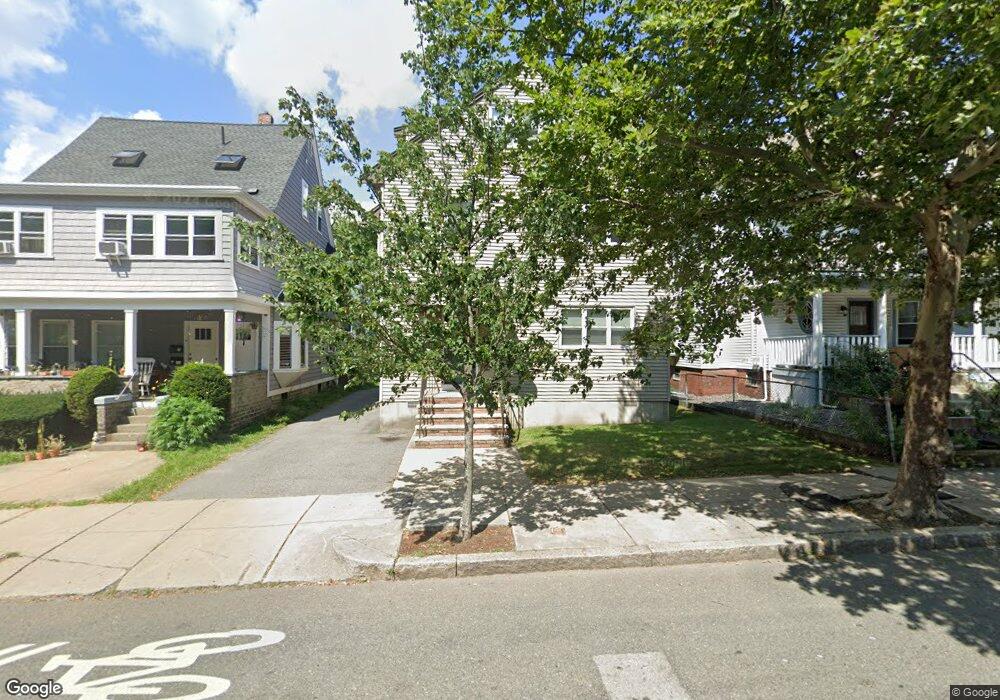
783 Broadway Unit 1 Somerville, MA 02144
Ball Square NeighborhoodEstimated Value: $1,380,000 - $1,888,000
3
Beds
1
Bath
1,200
Sq Ft
$1,386/Sq Ft
Est. Value
About This Home
This home is located at 783 Broadway Unit 1, Somerville, MA 02144 and is currently estimated at $1,662,690, approximately $1,385 per square foot. 783 Broadway Unit 1 is a home located in Middlesex County with nearby schools including Somerville High School and St. Clement Elementary School.
Ownership History
Date
Name
Owned For
Owner Type
Purchase Details
Closed on
Oct 7, 2021
Sold by
Canoy Shannon E and Fedora-Canoy Maria
Bought by
Canoy Broadway Llc
Current Estimated Value
Home Financials for this Owner
Home Financials are based on the most recent Mortgage that was taken out on this home.
Original Mortgage
$276,000
Outstanding Balance
$251,686
Interest Rate
2.8%
Mortgage Type
Stand Alone Refi Refinance Of Original Loan
Estimated Equity
$1,411,004
Purchase Details
Closed on
May 19, 2021
Sold by
Canoy Shannon E and Fodera-Canoy Maria
Bought by
Canoy Broadway Llc
Purchase Details
Closed on
Aug 18, 2010
Sold by
783 Broadway T and Fodera
Bought by
Fodera-Canoy Maria and Canoy Shannon Eugene
Create a Home Valuation Report for This Property
The Home Valuation Report is an in-depth analysis detailing your home's value as well as a comparison with similar homes in the area
Home Values in the Area
Average Home Value in this Area
Purchase History
| Date | Buyer | Sale Price | Title Company |
|---|---|---|---|
| Canoy Broadway Llc | -- | None Available | |
| Canoy Shannon E | -- | None Available | |
| Canoy Shannon E | -- | None Available | |
| Canoy Broadway Llc | -- | None Available | |
| Canoy Broadway Llc | -- | None Available | |
| Canoy Broadway Llc | -- | None Available | |
| Fodera-Canoy Maria | -- | -- | |
| Fodera-Canoy Maria | -- | -- |
Source: Public Records
Mortgage History
| Date | Status | Borrower | Loan Amount |
|---|---|---|---|
| Open | Canoy Shannon E | $276,000 | |
| Previous Owner | Fodera-Canoy Maria | $120,000 | |
| Previous Owner | Fodera-Canoy Maria | $180,000 | |
| Previous Owner | Fodera-Canoy Maria | $40,000 |
Source: Public Records
Tax History Compared to Growth
Tax History
| Year | Tax Paid | Tax Assessment Tax Assessment Total Assessment is a certain percentage of the fair market value that is determined by local assessors to be the total taxable value of land and additions on the property. | Land | Improvement |
|---|---|---|---|---|
| 2025 | $15,971 | $1,463,900 | $716,000 | $747,900 |
| 2024 | $15,259 | $1,450,500 | $716,000 | $734,500 |
| 2023 | $14,817 | $1,433,000 | $716,000 | $717,000 |
| 2022 | $13,956 | $1,370,900 | $681,900 | $689,000 |
| 2021 | $13,528 | $1,327,600 | $677,000 | $650,600 |
| 2020 | $13,011 | $1,289,500 | $677,400 | $612,100 |
| 2019 | $11,960 | $1,111,500 | $616,600 | $494,900 |
| 2018 | $10,997 | $972,300 | $560,600 | $411,700 |
| 2017 | $10,789 | $924,500 | $528,900 | $395,600 |
| 2016 | $10,431 | $832,500 | $472,300 | $360,200 |
| 2015 | $10,002 | $793,200 | $436,200 | $357,000 |
Source: Public Records
Map
Nearby Homes
- 25 Warner St
- 26 Warner St
- 54 Lowden Ave Unit 2
- 111 Pearson Rd
- 9 Kidder Ave Unit 2
- 15 Colby St
- 51 Foskett St Unit 2
- 74 Josephine Ave Unit B
- 39 Rogers Ave
- 81 Princeton St
- 60 Pearson Ave Unit 60
- 20 Electric Ave Unit 2
- 31 Wareham St
- 22 Ossipee Rd Unit 2
- 595 Broadway Unit 202
- 595 Broadway Unit 302
- 595 Broadway Unit 101
- 53 Paulina St
- 23 Highland Rd
- 67 Boston Ave Unit 67
- 783 Broadway
- 785 Broadway
- 779 Broadway
- 9 Warner St
- 15 Warner St
- 787 Broadway
- 19 Warner St
- 19 Warner St Unit 2
- 19 Warner St Unit 1
- 773 Broadway
- 773 Broadway Unit 2
- 21 Warner St
- 36 Pearson Rd
- 32 Pearson Rd
- 32 Pearson Rd Unit 1
- 32 Pearson Rd Unit 2
- 771 Broadway
- 771 Broadway Unit A
- 771 Broadway Unit 1
- 14 Warner St