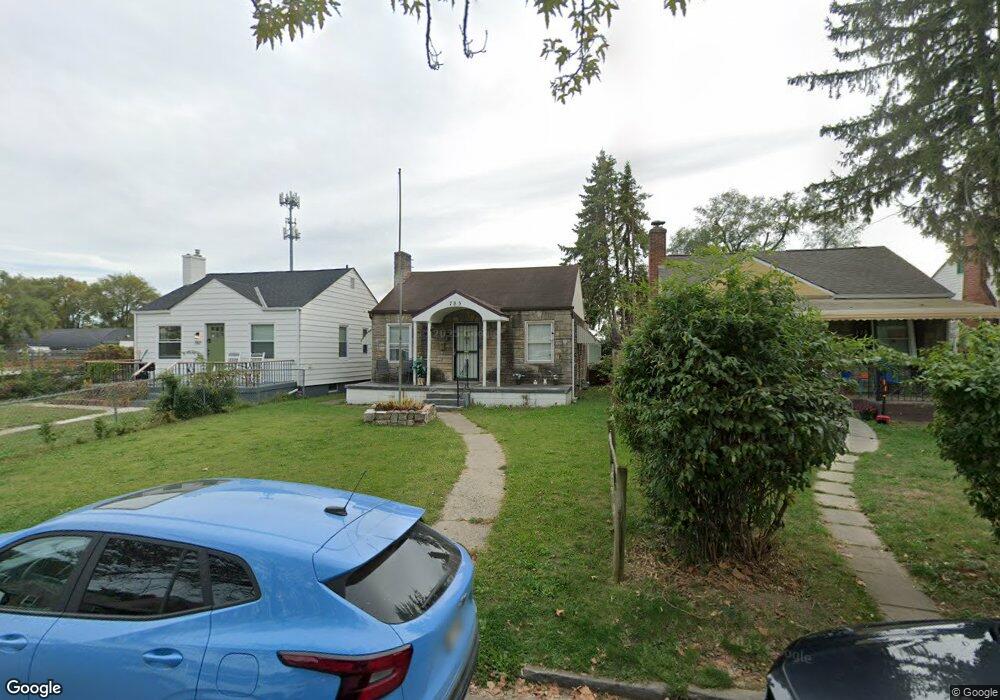
783 E Mithoff St Columbus, OH 43206
Karns Park NeighborhoodEstimated Value: $148,000 - $164,000
2
Beds
1
Bath
824
Sq Ft
$192/Sq Ft
Est. Value
About This Home
This home is located at 783 E Mithoff St, Columbus, OH 43206 and is currently estimated at $158,592, approximately $192 per square foot. 783 E Mithoff St is a home located in Franklin County with nearby schools including Lincoln Park Elementary School, South High School, and St Pauls Lutheran School.
Ownership History
Date
Name
Owned For
Owner Type
Purchase Details
Closed on
Mar 4, 2009
Sold by
Root Mark A and Case #08Cve07 9659
Bought by
Deutsche Bank National Trust Company
Current Estimated Value
Purchase Details
Closed on
Feb 27, 2009
Sold by
Deutsche Bank National Trust Company
Bought by
Bednarczyk Mieczyslaw
Purchase Details
Closed on
Jun 26, 2006
Sold by
Root Mark A
Bought by
Bailey Wm and 783 Mithoff Street Residential
Purchase Details
Closed on
Aug 12, 2002
Sold by
Beasley Lenzie and Centar Fsb
Bought by
Root Mark A
Home Financials for this Owner
Home Financials are based on the most recent Mortgage that was taken out on this home.
Original Mortgage
$32,000
Interest Rate
6.18%
Purchase Details
Closed on
Aug 3, 2001
Sold by
Cardinal Title Holding Company
Bought by
City Of Columbus
Purchase Details
Closed on
Dec 20, 1976
Bought by
Beasley Lenzie
Create a Home Valuation Report for This Property
The Home Valuation Report is an in-depth analysis detailing your home's value as well as a comparison with similar homes in the area
Home Values in the Area
Average Home Value in this Area
Purchase History
| Date | Buyer | Sale Price | Title Company |
|---|---|---|---|
| Deutsche Bank National Trust Company | $57,960 | None Available | |
| Bednarczyk Mieczyslaw | $15,000 | Landcastle | |
| Bailey Wm | -- | None Available | |
| Root Mark A | $32,100 | -- | |
| City Of Columbus | -- | -- | |
| Beasley Lenzie | -- | -- |
Source: Public Records
Mortgage History
| Date | Status | Borrower | Loan Amount |
|---|---|---|---|
| Previous Owner | Root Mark A | $32,000 |
Source: Public Records
Tax History
| Year | Tax Paid | Tax Assessment Tax Assessment Total Assessment is a certain percentage of the fair market value that is determined by local assessors to be the total taxable value of land and additions on the property. | Land | Improvement |
|---|---|---|---|---|
| 2025 | $3,759 | $52,720 | $20,550 | $32,170 |
| 2024 | $3,759 | $52,720 | $20,550 | $32,170 |
| 2023 | $2,386 | $52,710 | $20,545 | $32,165 |
| 2022 | $842 | $13,030 | $4,590 | $8,440 |
| 2021 | $694 | $13,030 | $4,590 | $8,440 |
| 2020 | $695 | $13,030 | $4,590 | $8,440 |
| 2019 | $636 | $10,230 | $3,820 | $6,410 |
| 2018 | $846 | $10,230 | $3,820 | $6,410 |
| 2017 | $636 | $10,230 | $3,820 | $6,410 |
| 2016 | $1,161 | $17,090 | $3,680 | $13,410 |
| 2015 | $1,057 | $17,090 | $3,680 | $13,410 |
| 2014 | $1,060 | $17,090 | $3,680 | $13,410 |
| 2013 | $599 | $17,955 | $3,850 | $14,105 |
Source: Public Records
Map
Nearby Homes
- 0 Gilbert St
- 798 E Mithoff St
- 1263 Heyl Ave
- 1226-1228 Gilbert St
- 704 Hanford St
- 693 Thurman Ave
- 650 E Mithoff St
- 1404 S Ohio Ave
- 1352-1354 S Champion Ave
- 1174-1176 S 22nd St
- 1229-1231 S Champion Ave
- 1196 S Ohio Ave
- 1225-1227 S Champion Ave
- 676 E Moler St
- 0 Oakwood Ave
- 573 E Mithoff St
- 1472 S Champion Ave
- 524 Thurman Ave
- 000 Gilbert St
- 00 Gilbert St
- 783 E Mithoff St Unit L23
- 779 E Mithoff St
- 775 E Mithoff St
- 769 E Mithoff St
- 765 E Mithoff St
- 1324 Gilbert St
- 784-786 E Mithoff St
- 790 E Mithoff St
- 778 E Mithoff St Unit 780
- 794 E Mithoff St
- 1330 Gilbert St
- 772-774 E Mithoff St
- 772 E Mithoff St Unit 774
- 755 E Mithoff St
- 802 E Mithoff St
- 766 E Mithoff St
- 753 E Mithoff St
- 753 E Mithoff St Unit 753
- 753 E Mithoff St Unit 53
- 751-753 E Mithoff St
Your Personal Tour Guide
Ask me questions while you tour the home.