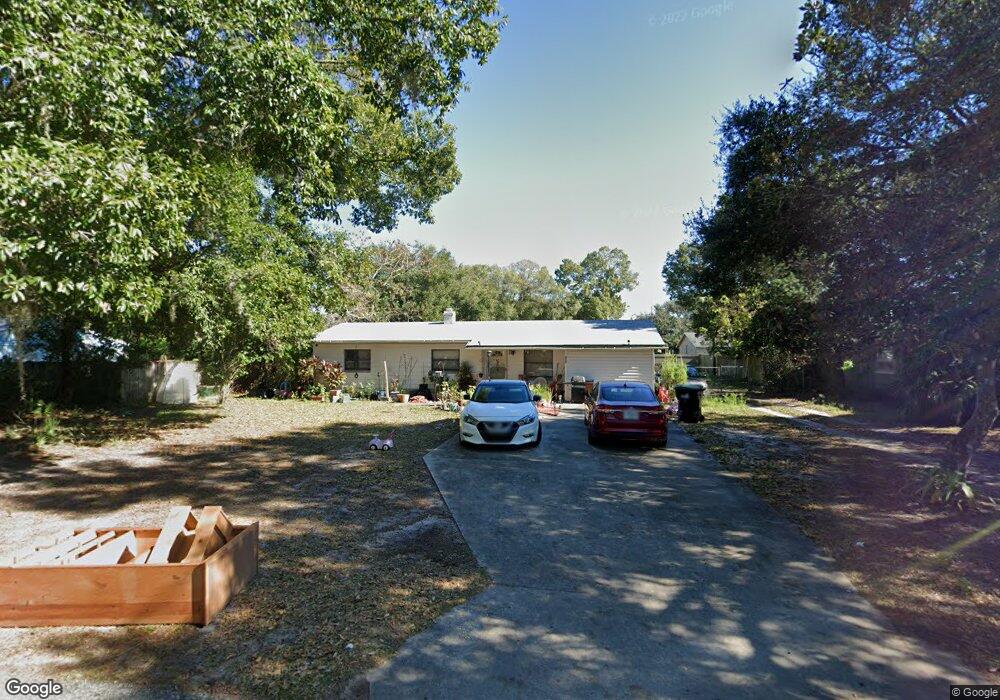
783 Eldridge St Orlando, FL 32803
Estimated Value: $267,000 - $358,574
3
Beds
2
Baths
1,698
Sq Ft
$182/Sq Ft
Est. Value
About This Home
This home is located at 783 Eldridge St, Orlando, FL 32803 and is currently estimated at $309,144, approximately $182 per square foot. 783 Eldridge St is a home located in Orange County with nearby schools including Baldwin Park Elementary, Glenridge Middle, and Winter Park High.
Ownership History
Date
Name
Owned For
Owner Type
Purchase Details
Closed on
Feb 27, 2004
Sold by
Robinson Hugh David and Robinson Patricia Ann
Bought by
Bryant Kenneth Gerald and Bryant Betty Sue
Current Estimated Value
Home Financials for this Owner
Home Financials are based on the most recent Mortgage that was taken out on this home.
Original Mortgage
$103,500
Outstanding Balance
$48,541
Interest Rate
5.72%
Mortgage Type
Purchase Money Mortgage
Estimated Equity
$260,603
Create a Home Valuation Report for This Property
The Home Valuation Report is an in-depth analysis detailing your home's value as well as a comparison with similar homes in the area
Purchase History
| Date | Buyer | Sale Price | Title Company |
|---|---|---|---|
| Bryant Kenneth Gerald | $115,000 | Cosmopolitan Title Agency In |
Source: Public Records
Mortgage History
| Date | Status | Borrower | Loan Amount |
|---|---|---|---|
| Open | Bryant Kenneth Gerald | $103,500 |
Source: Public Records
Tax History
| Year | Tax Paid | Tax Assessment Tax Assessment Total Assessment is a certain percentage of the fair market value that is determined by local assessors to be the total taxable value of land and additions on the property. | Land | Improvement |
|---|---|---|---|---|
| 2025 | $4,836 | $215,586 | -- | -- |
| 2024 | $3,725 | $195,987 | -- | -- |
| 2023 | $3,725 | $251,022 | $115,000 | $136,022 |
| 2022 | $3,347 | $220,435 | $105,000 | $115,435 |
| 2021 | $3,035 | $182,996 | $105,000 | $77,996 |
| 2020 | $2,797 | $180,672 | $105,000 | $75,672 |
| 2019 | $2,635 | $155,126 | $65,000 | $90,126 |
| 2018 | $2,467 | $141,890 | $50,000 | $91,890 |
| 2017 | $2,315 | $132,874 | $50,000 | $82,874 |
| 2016 | $2,130 | $118,183 | $50,000 | $68,183 |
| 2015 | $1,967 | $101,520 | $35,000 | $66,520 |
| 2014 | $1,865 | $85,382 | $26,000 | $59,382 |
Source: Public Records
Map
Nearby Homes
- 793 Eldridge St
- 861 High St
- 812 High St
- 1927 Risby Aly Unit 19
- 1927 Risby Aly
- 1926 Risby Aly Unit 16
- 921 Eldridge St
- 972 Baldwin Cove Way
- 1009 Jamajo Blvd
- 4715 Beach Blvd
- 5314 Old Cheney Hwy
- 4330 Rixey St
- 4333 Roush Ave
- 4329 Roush Ave
- 4317 Roush Ave
- 4313 Roush Ave
- 901 Lake Baldwin Ln
- 814 Irwin Dr
- 1014 N Solandra Dr
- 1333 Susannah Blvd
- 777 Eldridge St
- 787 Eldridge St
- 5055 Old Cheney Hwy
- 775 Eldridge St
- 5045 Old Cheney Hwy Unit A&B
- 5045 Old Cheney Hwy
- 5065 Old Cheney Hwy
- 789 Eldridge St
- 784 Eldridge St
- 780 Eldridge St
- 0 Eldridge St
- 5103 Old Cheney Hwy
- 788 Eldridge St
- 776 Eldridge St
- 747 Eldridge St
- 790 Eldridge St
- 790 Eldridge St
- 5049 Old Cheney Hwy
- 5039 Old Cheney Hwy Unit C
- 5039 Old Cheney Hwy Unit 2
Your Personal Tour Guide
Ask me questions while you tour the home.