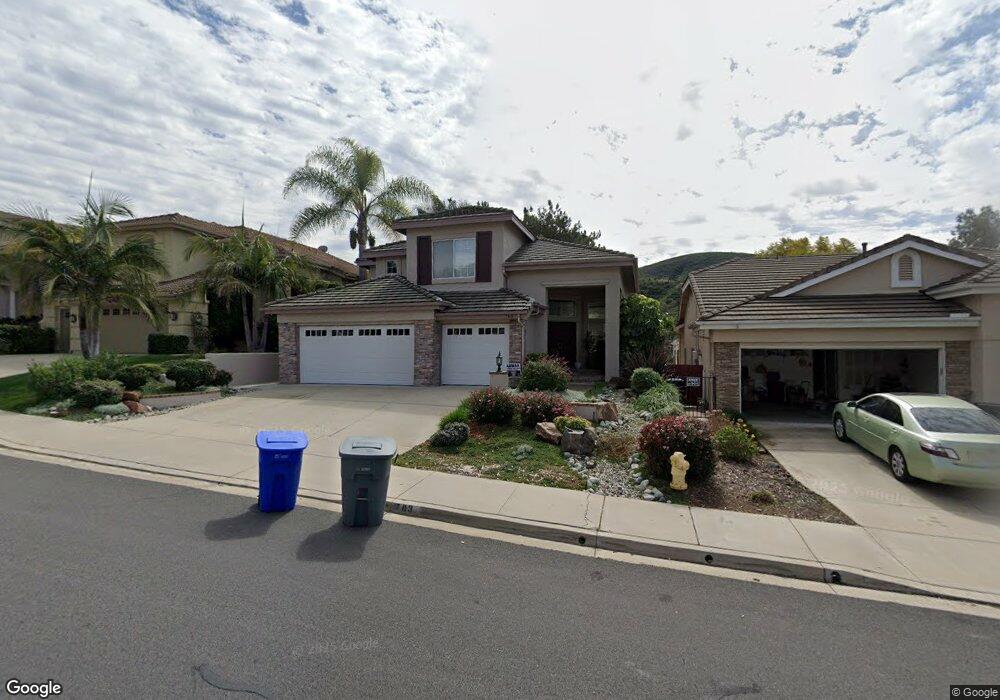
783 Poppy Rd San Marcos, CA 92078
Barham Discovery Community NeighborhoodEstimated Value: $1,162,000 - $1,171,000
4
Beds
3
Baths
2,118
Sq Ft
$551/Sq Ft
Est. Value
About This Home
This home is located at 783 Poppy Rd, San Marcos, CA 92078 and is currently estimated at $1,167,669, approximately $551 per square foot. 783 Poppy Rd is a home located in San Diego County with nearby schools including Discovery Elementary School, San Elijo Middle School, and San Marcos High School.
Ownership History
Date
Name
Owned For
Owner Type
Purchase Details
Closed on
Apr 26, 2017
Sold by
Ryan Barbara
Bought by
Ryan Barbara A
Current Estimated Value
Home Financials for this Owner
Home Financials are based on the most recent Mortgage that was taken out on this home.
Original Mortgage
$421,000
Outstanding Balance
$345,206
Interest Rate
3.6%
Mortgage Type
Adjustable Rate Mortgage/ARM
Estimated Equity
$822,463
Purchase Details
Closed on
Feb 22, 2006
Sold by
Ryan Barbara
Bought by
Ryan Barbara A
Purchase Details
Closed on
Feb 24, 2005
Sold by
Ryan Barbara
Bought by
Ryan Barbara
Home Financials for this Owner
Home Financials are based on the most recent Mortgage that was taken out on this home.
Original Mortgage
$400,000
Interest Rate
5.66%
Mortgage Type
New Conventional
Purchase Details
Closed on
Jul 16, 2003
Sold by
Ryan J K
Bought by
Ryan Barbara
Purchase Details
Closed on
Mar 5, 1997
Sold by
Dale Walker
Bought by
Ryan J K and Ryan Barbara
Purchase Details
Closed on
Oct 30, 1992
Create a Home Valuation Report for This Property
The Home Valuation Report is an in-depth analysis detailing your home's value as well as a comparison with similar homes in the area
Home Values in the Area
Average Home Value in this Area
Purchase History
| Date | Buyer | Sale Price | Title Company |
|---|---|---|---|
| Ryan Barbara A | -- | Accommodation | |
| Ryan Barbara | -- | Title 365 | |
| Ryan Barbara A | -- | None Available | |
| Ryan Barbara | -- | First American Title | |
| Ryan Barbara | -- | California Title Company | |
| Ryan J K | $224,000 | First American Title | |
| -- | $244,100 | -- |
Source: Public Records
Mortgage History
| Date | Status | Borrower | Loan Amount |
|---|---|---|---|
| Open | Ryan Barbara | $421,000 | |
| Closed | Ryan Barbara | $400,000 |
Source: Public Records
Tax History Compared to Growth
Tax History
| Year | Tax Paid | Tax Assessment Tax Assessment Total Assessment is a certain percentage of the fair market value that is determined by local assessors to be the total taxable value of land and additions on the property. | Land | Improvement |
|---|---|---|---|---|
| 2025 | $4,399 | $364,802 | $97,706 | $267,096 |
| 2024 | $4,399 | $357,650 | $95,791 | $261,859 |
| 2023 | $4,320 | $350,638 | $93,913 | $256,725 |
| 2022 | $4,262 | $343,764 | $92,072 | $251,692 |
| 2021 | $4,193 | $337,024 | $90,267 | $246,757 |
| 2020 | $4,153 | $333,569 | $89,342 | $244,227 |
| 2019 | $4,068 | $327,030 | $87,591 | $239,439 |
| 2018 | $3,946 | $320,619 | $85,874 | $234,745 |
| 2017 | $3,871 | $314,334 | $84,191 | $230,143 |
| 2016 | $3,813 | $308,172 | $82,541 | $225,631 |
| 2015 | $4,467 | $303,544 | $81,302 | $222,242 |
| 2014 | $4,374 | $297,599 | $79,710 | $217,889 |
Source: Public Records
Map
Nearby Homes
- 797 Trailside Place
- 650 #291 S Rancho Santa fe Rd
- 1027 Cima Dr
- 1048 Via Vera Cruz
- 597 Middlebrook Rd
- 1021 Mockingbird Ln
- 1324 Vista Colina Dr
- 0 Vista Colina
- 550 Echo Ln
- 380 Avenida la Cuesta
- 1205 Sunrise View Unit 105
- 1310 Miracielo Ct
- 1261 Granada Way
- 1054 La Sombra Dr
- 1911 La Subida Way
- 1051 La Reina Dr
- 694 Metric Rd
- 1235 W San Marcos Blvd Unit 4
- 653 Fahrenheit Rd
- 1234 Sunrise View Unit 101