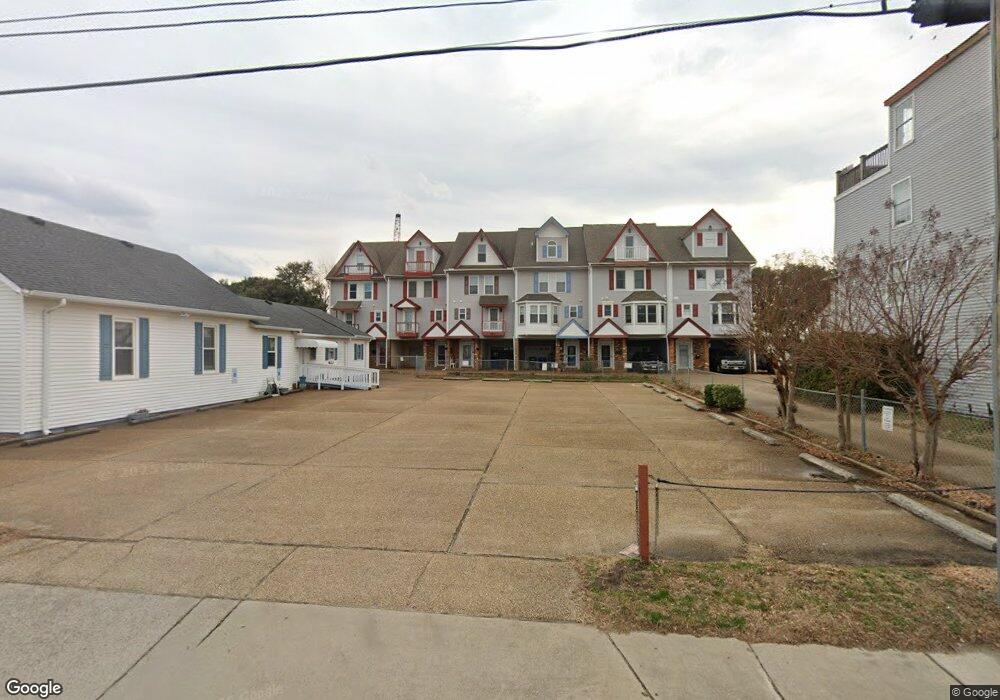
783 W Ocean View Ave Norfolk, VA 23503
Willoughby NeighborhoodEstimated Value: $465,000 - $549,000
3
Beds
3
Baths
1,893
Sq Ft
$277/Sq Ft
Est. Value
About This Home
This home is located at 783 W Ocean View Ave, Norfolk, VA 23503 and is currently estimated at $525,128, approximately $277 per square foot. 783 W Ocean View Ave is a home located in Norfolk City with nearby schools including Ocean View Elementary School, Northside Middle School, and Granby High School.
Ownership History
Date
Name
Owned For
Owner Type
Purchase Details
Closed on
Mar 18, 2015
Sold by
Us Bank National Association As Trustee
Bought by
Santiago Melissa
Current Estimated Value
Home Financials for this Owner
Home Financials are based on the most recent Mortgage that was taken out on this home.
Original Mortgage
$204,300
Outstanding Balance
$156,473
Interest Rate
3.68%
Mortgage Type
VA
Estimated Equity
$368,655
Purchase Details
Closed on
Nov 11, 2014
Sold by
Turner Darren L
Bought by
Us Bank National Association As Trustee and Cmalt Remic 2007-A4-Remic Pass-Through C
Purchase Details
Closed on
Mar 28, 2006
Sold by
Dejarnett Jennifer L
Bought by
Turner Darren and Turner Darren L
Home Financials for this Owner
Home Financials are based on the most recent Mortgage that was taken out on this home.
Original Mortgage
$448,000
Interest Rate
1%
Mortgage Type
Adjustable Rate Mortgage/ARM
Create a Home Valuation Report for This Property
The Home Valuation Report is an in-depth analysis detailing your home's value as well as a comparison with similar homes in the area
Home Values in the Area
Average Home Value in this Area
Purchase History
| Date | Buyer | Sale Price | Title Company |
|---|---|---|---|
| Santiago Melissa | $200,000 | Sage Title Llc | |
| Us Bank National Association As Trustee | $464,000 | Servicelink | |
| Turner Darren | $560,000 | -- |
Source: Public Records
Mortgage History
| Date | Status | Borrower | Loan Amount |
|---|---|---|---|
| Open | Santiago Melissa | $204,300 | |
| Previous Owner | Turner Darren | $448,000 |
Source: Public Records
Tax History
| Year | Tax Paid | Tax Assessment Tax Assessment Total Assessment is a certain percentage of the fair market value that is determined by local assessors to be the total taxable value of land and additions on the property. | Land | Improvement |
|---|---|---|---|---|
| 2025 | $6,933 | $554,600 | $109,400 | $445,200 |
| 2024 | $5,793 | $463,400 | $109,400 | $354,000 |
| 2023 | $4,966 | $397,300 | $109,400 | $287,900 |
| 2022 | $4,796 | $383,700 | $109,400 | $274,300 |
| 2021 | $4,365 | $349,200 | $106,200 | $243,000 |
| 2020 | $4,253 | $340,200 | $97,200 | $243,000 |
| 2019 | $4,096 | $327,700 | $97,200 | $230,500 |
| 2018 | $3,884 | $310,700 | $97,200 | $213,500 |
| 2017 | $3,344 | $290,800 | $81,000 | $209,800 |
| 2016 | $3,299 | $377,100 | $131,400 | $245,700 |
| 2015 | $4,102 | $377,100 | $131,400 | $245,700 |
| 2014 | $4,102 | $377,100 | $131,400 | $245,700 |
Source: Public Records
Map
Nearby Homes
- 757 W Ocean View Ave
- 802 W Ocean View Ave
- 820 Willoughby Bay Ave
- 737 W Ocean View Ave Unit A
- 831 W Ocean View Ave
- 822 W Ocean View Ave
- 728 W Ocean View Ave
- 840 W Ocean View Ave
- 842 W Ocean View Ave
- 831 Little Bay Ave Unit A
- 835 Little Bay Ave Unit E
- 861 Little Bay Ave
- 859 Little Bay Ave
- 863 Little Bay Ave Unit 1
- 880 W Ocean View Ave
- 639 W Ocean View Ave
- 966 W Ocean View Ave
- 600 W Ocean View Ave Unit C
- 583 W Ocean View Ave Unit A
- 569 W Ocean View Ave
- 785 W Ocean View Ave
- 781 W Ocean View Ave
- 787 W Ocean View Ave
- 779 W Ocean View Ave
- 789 W Ocean View Ave
- 777 W Ocean View Ave
- 775 W Ocean View Ave Unit Ave
- 793 W Ocean View Ave
- 791 W Ocean View Ave
- 773 W Ocean View Ave
- 769 W Ocean View Ave
- 795 W Ocean View Ave
- 771 W Ocean View Ave
- 769 Ocean View Ave (771) W
- 799 W Ocean View Ave
- 767 W Ocean View Ave
- 765 W Ocean View Ave
- 763 W Ocean View Ave
- 801 W Ocean View Ave
- 759 W Ocean View Ave
Your Personal Tour Guide
Ask me questions while you tour the home.