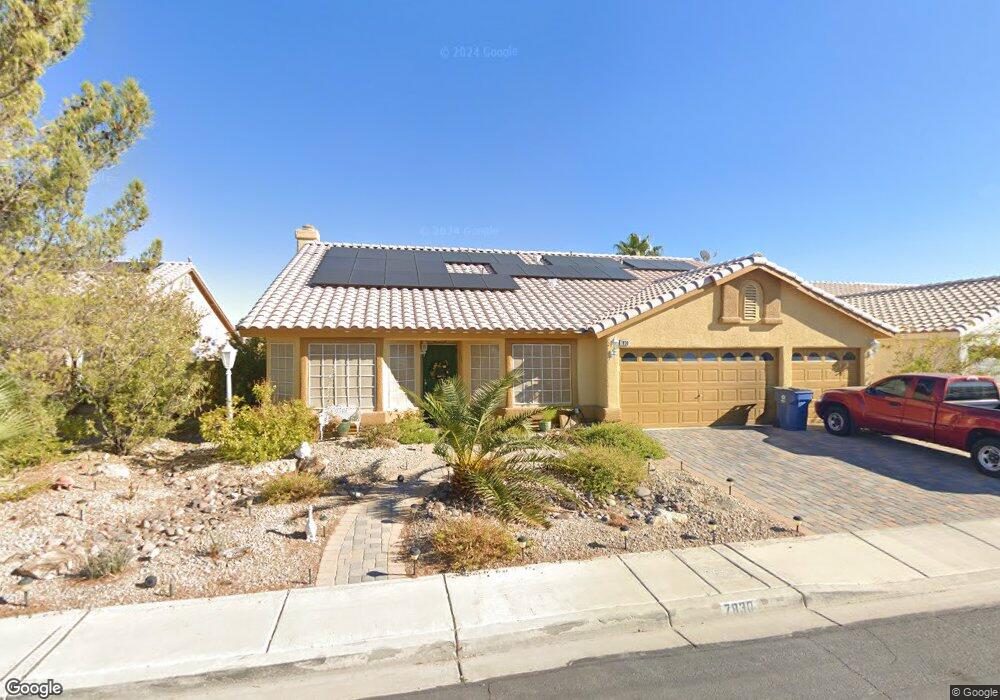
7830 Fandango Ct Las Vegas, NV 89123
Silverado Ranch NeighborhoodEstimated Value: $539,000 - $546,000
3
Beds
3
Baths
1,967
Sq Ft
$275/Sq Ft
Est. Value
About This Home
This home is located at 7830 Fandango Ct, Las Vegas, NV 89123 and is currently estimated at $541,793, approximately $275 per square foot. 7830 Fandango Ct is a home located in Clark County with nearby schools including Charlotte Hill Elementary School, Louis Wiener Jr Elementary School, and Jack Lund Schofield Middle School.
Ownership History
Date
Name
Owned For
Owner Type
Purchase Details
Closed on
Sep 1, 2022
Sold by
Arthur Truman Sidney and Arthur Phyllis
Bought by
Truman Family Trust
Current Estimated Value
Purchase Details
Closed on
May 1, 2007
Sold by
Truman Phyllis and Truman Sidney Arthur
Bought by
Truman Sidney Arthur and Truman Phyllis
Home Financials for this Owner
Home Financials are based on the most recent Mortgage that was taken out on this home.
Original Mortgage
$456,000
Interest Rate
5.9%
Mortgage Type
Reverse Mortgage Home Equity Conversion Mortgage
Purchase Details
Closed on
Apr 13, 2004
Sold by
Zmh Development Inc
Bought by
Ross Frank and Salamone Valerie
Purchase Details
Closed on
Feb 7, 1996
Sold by
Truman Phyllis
Bought by
Truman Phyllis and Truman Sidney Arthur
Purchase Details
Closed on
Nov 21, 1995
Sold by
Truman Sidney Arthur George
Bought by
Truman Phyllis
Home Financials for this Owner
Home Financials are based on the most recent Mortgage that was taken out on this home.
Original Mortgage
$108,400
Interest Rate
7.42%
Create a Home Valuation Report for This Property
The Home Valuation Report is an in-depth analysis detailing your home's value as well as a comparison with similar homes in the area
Home Values in the Area
Average Home Value in this Area
Purchase History
| Date | Buyer | Sale Price | Title Company |
|---|---|---|---|
| Truman Family Trust | -- | -- | |
| Truman Sidney Arthur | -- | Ticor Title Of Nevada Inc | |
| Ross Frank | $188,960 | Lawyers Title Of Nevada | |
| Truman Phyllis | -- | -- | |
| Truman Phyllis | -- | Nevada Title Company | |
| Truman Phyllis | $153,500 | Nevada Title Company |
Source: Public Records
Mortgage History
| Date | Status | Borrower | Loan Amount |
|---|---|---|---|
| Previous Owner | Truman Sidney Arthur | $456,000 | |
| Previous Owner | Truman Phyllis | $108,400 |
Source: Public Records
Tax History Compared to Growth
Tax History
| Year | Tax Paid | Tax Assessment Tax Assessment Total Assessment is a certain percentage of the fair market value that is determined by local assessors to be the total taxable value of land and additions on the property. | Land | Improvement |
|---|---|---|---|---|
| 2025 | $2,340 | $123,348 | $37,100 | $86,248 |
| 2024 | $2,273 | $123,348 | $37,100 | $86,248 |
| 2023 | $1,854 | $119,164 | $37,450 | $81,714 |
| 2022 | $2,207 | $108,554 | $33,250 | $75,304 |
| 2021 | $2,142 | $102,894 | $31,150 | $71,744 |
| 2020 | $2,077 | $101,054 | $29,750 | $71,304 |
| 2019 | $2,017 | $98,201 | $28,000 | $70,201 |
| 2018 | $1,958 | $92,502 | $24,500 | $68,002 |
| 2017 | $2,758 | $94,055 | $24,850 | $69,205 |
| 2016 | $1,854 | $79,832 | $10,500 | $69,332 |
| 2015 | $1,850 | $61,206 | $9,800 | $51,406 |
| 2014 | $1,796 | $60,048 | $8,750 | $51,298 |
Source: Public Records
Map
Nearby Homes
- 7751 Radcliff St
- 825 Royal Moon Ave
- 932 Royal Moon Ave
- 7745 Radcliff St
- 887 Centaur Ave
- 920 Serpentina Ave
- 884 E Robindale Rd
- 865 Buffwood Ave
- 747 Canyon Crest Dr
- 915 Brass Ring Rd
- 7736 Foredawn Dr
- 7857 Cliffs Edge Cir
- 7618 Poppy Meadow St
- 7585 Hartwell Dr
- 7668 Friendly Breeze Ct
- 591 Jerry Bird Ct
- 585 Via Alhambra Ct
- Floor Plan 3125 at Robindale Ranch
- Floor Plan 2797 at Robindale Ranch
- Floor Plan 2752 at Robindale Ranch
- 7838 Fandango Ct
- 7820 Fandango Ct
- 7829 Waltz St
- 7837 Waltz St
- 7846 Fandango Ct
- 7812 Fandango Ct
- 7829 Fandango Ct
- 7819 Waltz St
- 7845 Waltz St
- 7821 Fandango Ct
- 7837 Fandango Ct
- 7854 Fandango Ct
- 7845 Fandango Ct
- 7811 Fandango Ct
- 7853 Waltz St
- 900 Dawnlight Ave
- 7853 Fandango Ct
- 7830 Rain Shadow Ct
- 7862 Fandango Ct
- 7832 Waltz St