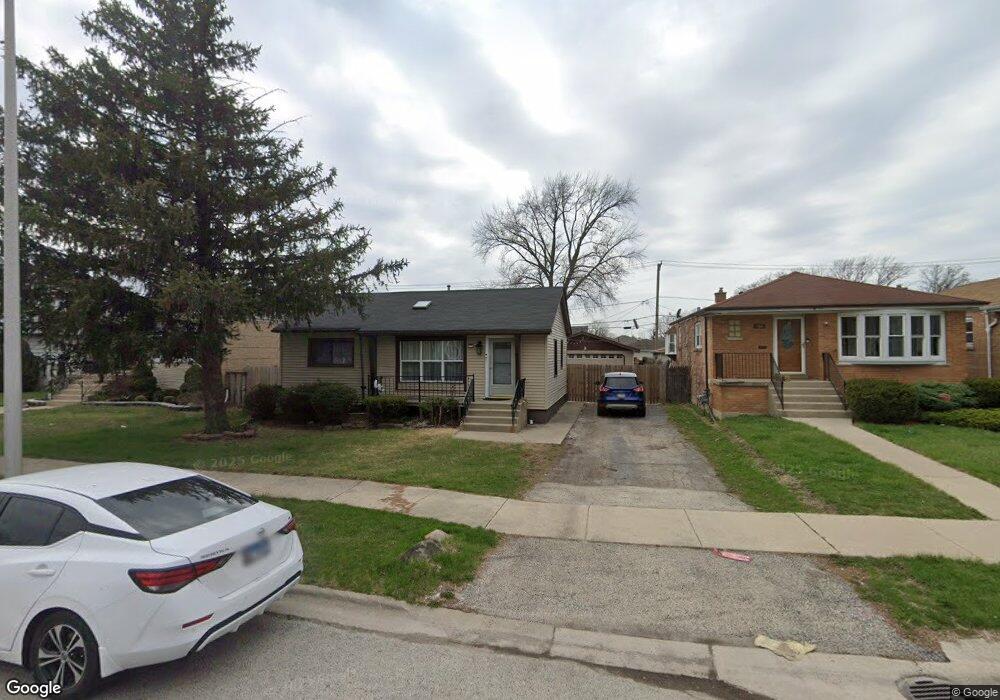
7830 Neenah Ave Burbank, IL 60459
Estimated Value: $234,000 - $285,000
2
Beds
1
Bath
816
Sq Ft
$308/Sq Ft
Est. Value
About This Home
This home is located at 7830 Neenah Ave, Burbank, IL 60459 and is currently estimated at $251,221, approximately $307 per square foot. 7830 Neenah Ave is a home located in Cook County with nearby schools including Harry E. Fry School, Reavis High School, and St Albert the Great Catholic School.
Ownership History
Date
Name
Owned For
Owner Type
Purchase Details
Closed on
Jan 19, 2022
Sold by
Salim Mike
Bought by
Nagem Chimaa
Current Estimated Value
Purchase Details
Closed on
Aug 13, 2021
Sold by
Salim Mike
Bought by
Nagem Chimaa
Purchase Details
Closed on
Mar 29, 2002
Sold by
Nolan Robert J and Nolan Connie L
Bought by
Nagem Chimaa
Home Financials for this Owner
Home Financials are based on the most recent Mortgage that was taken out on this home.
Original Mortgage
$114,855
Interest Rate
6.87%
Create a Home Valuation Report for This Property
The Home Valuation Report is an in-depth analysis detailing your home's value as well as a comparison with similar homes in the area
Home Values in the Area
Average Home Value in this Area
Purchase History
| Date | Buyer | Sale Price | Title Company |
|---|---|---|---|
| Nagem Chimaa | -- | -- | |
| Nagem Chimaa | -- | -- | |
| Nagem Chimaa | -- | -- | |
| Nagem Chimaa | $121,000 | -- |
Source: Public Records
Mortgage History
| Date | Status | Borrower | Loan Amount |
|---|---|---|---|
| Previous Owner | Nagem Chimaa | $114,855 |
Source: Public Records
Tax History
| Year | Tax Paid | Tax Assessment Tax Assessment Total Assessment is a certain percentage of the fair market value that is determined by local assessors to be the total taxable value of land and additions on the property. | Land | Improvement |
|---|---|---|---|---|
| 2025 | $4,312 | $17,211 | $7,011 | $10,200 |
| 2024 | $4,312 | $17,211 | $7,011 | $10,200 |
| 2023 | $3,847 | $17,211 | $7,011 | $10,200 |
| 2022 | $3,847 | $13,398 | $6,089 | $7,309 |
| 2021 | $3,715 | $13,397 | $6,088 | $7,309 |
| 2020 | $3,665 | $13,397 | $6,088 | $7,309 |
| 2019 | $3,116 | $12,126 | $5,535 | $6,591 |
| 2018 | $3,025 | $12,126 | $5,535 | $6,591 |
| 2017 | $2,945 | $12,126 | $5,535 | $6,591 |
| 2016 | $3,186 | $11,539 | $4,612 | $6,927 |
| 2015 | $3,024 | $11,539 | $4,612 | $6,927 |
| 2014 | $2,951 | $11,539 | $4,612 | $6,927 |
| 2013 | $3,098 | $12,935 | $4,612 | $8,323 |
Source: Public Records
Map
Nearby Homes
- 7852 Neenah Ave
- 7745 Nashville Ave
- 7805 Natchez Ave
- 7820 Nagle Ave
- 7920 Natoma Ave
- 7709 Neenah Ave
- 7733 Rutherford Ave
- 8014 Mobile Ave
- 7948 Merrimac Ave
- 6520 W 82nd St
- 7715 New England Ave
- 6515 82nd St
- 6437 W 82nd St
- 7901 Newland Ave
- 7949 Newland Ave
- 7723 Melvina Ave
- 6124 W 79th St
- 7851 Moody Ave
- 8053 Newland Ave
- 8036 Newland Ave
- 7838 Neenah Ave
- 7814 Neenah Ave
- 7814 Neenah Ave
- 7812 Neenah Ave
- 7840 Neenah Ave
- 7810 Neenah Ave
- 7829 Nashville Ave
- 7827 Nashville Ave
- 7833 Nashville Ave
- 7808 Neenah Ave
- 7837 Nashville Ave
- 7815 Nashville Ave
- 7827 Neenah Ave
- 7839 Nashville Ave
- 7813 Nashville Ave
- 7819 Neenah Ave
- 7821 Neenah Ave
- 7817 Neenah Ave
- 7827 Neenah Ave
- 7841 Nashville Ave
Your Personal Tour Guide
Ask me questions while you tour the home.