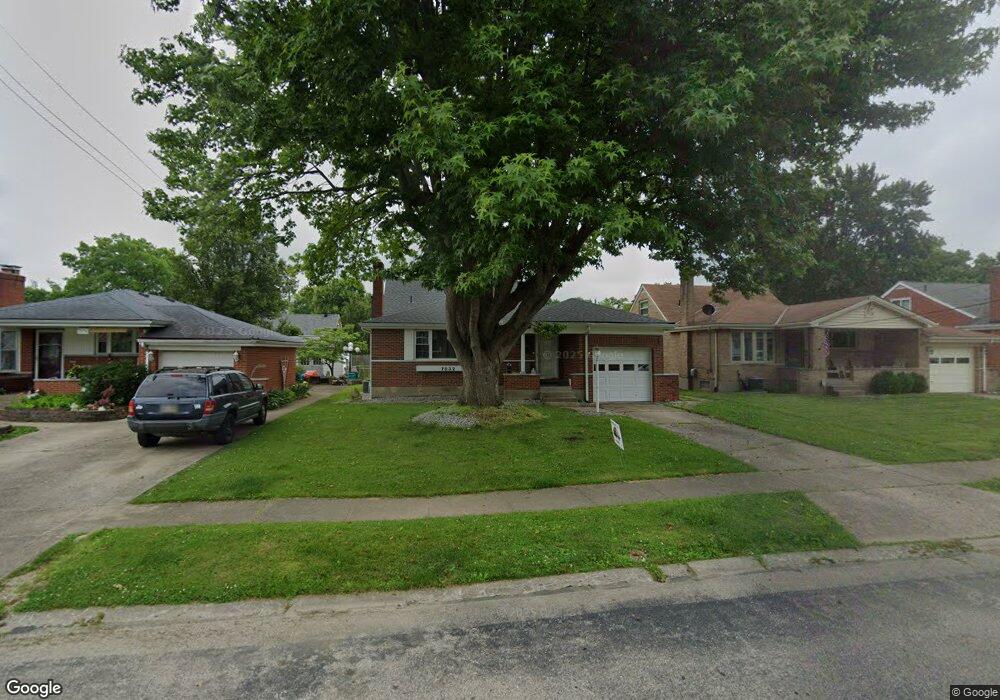
7832 Colton Ln Cincinnati, OH 45236
Estimated Value: $288,000 - $318,000
3
Beds
2
Baths
1,286
Sq Ft
$233/Sq Ft
Est. Value
About This Home
This home is located at 7832 Colton Ln, Cincinnati, OH 45236 and is currently estimated at $299,870, approximately $233 per square foot. 7832 Colton Ln is a home located in Hamilton County with nearby schools including Amity Elementary School, Deer Park Jr/Sr High School, and Ohr Torah Cincinnati.
Ownership History
Date
Name
Owned For
Owner Type
Purchase Details
Closed on
Jul 2, 2003
Sold by
Weaver Bobby G
Bought by
Woebkenberg Patricia J
Current Estimated Value
Home Financials for this Owner
Home Financials are based on the most recent Mortgage that was taken out on this home.
Original Mortgage
$129,010
Outstanding Balance
$53,351
Interest Rate
5.36%
Mortgage Type
Unknown
Estimated Equity
$246,519
Purchase Details
Closed on
Jan 28, 2000
Sold by
Lentz Jane A
Bought by
Hargis Thomas and Hargis Patricia
Home Financials for this Owner
Home Financials are based on the most recent Mortgage that was taken out on this home.
Original Mortgage
$118,000
Interest Rate
11.8%
Purchase Details
Closed on
Jun 3, 1997
Sold by
Lentz Thomas G
Bought by
Lentz Jane A
Create a Home Valuation Report for This Property
The Home Valuation Report is an in-depth analysis detailing your home's value as well as a comparison with similar homes in the area
Home Values in the Area
Average Home Value in this Area
Purchase History
| Date | Buyer | Sale Price | Title Company |
|---|---|---|---|
| Woebkenberg Patricia J | $133,000 | -- | |
| Hargis Thomas | $118,000 | Gobal Title Agency Inc | |
| Lentz Jane A | -- | -- |
Source: Public Records
Mortgage History
| Date | Status | Borrower | Loan Amount |
|---|---|---|---|
| Open | Woebkenberg Patricia J | $129,010 | |
| Previous Owner | Hargis Thomas | $118,000 |
Source: Public Records
Tax History
| Year | Tax Paid | Tax Assessment Tax Assessment Total Assessment is a certain percentage of the fair market value that is determined by local assessors to be the total taxable value of land and additions on the property. | Land | Improvement |
|---|---|---|---|---|
| 2025 | $5,359 | $71,887 | $11,515 | $60,372 |
| 2024 | $4,612 | $71,887 | $11,515 | $60,372 |
| 2023 | $4,623 | $71,887 | $11,515 | $60,372 |
| 2022 | $4,539 | $54,534 | $9,751 | $44,783 |
| 2021 | $4,519 | $54,534 | $9,751 | $44,783 |
| 2020 | $4,102 | $54,534 | $9,751 | $44,783 |
| 2019 | $4,017 | $47,838 | $8,554 | $39,284 |
| 2018 | $4,015 | $47,838 | $8,554 | $39,284 |
| 2017 | $3,869 | $47,838 | $8,554 | $39,284 |
| 2016 | $3,662 | $44,300 | $8,897 | $35,403 |
| 2015 | $3,316 | $44,300 | $8,897 | $35,403 |
| 2014 | $3,312 | $44,300 | $8,897 | $35,403 |
| 2013 | $3,221 | $42,595 | $8,554 | $34,041 |
Source: Public Records
Map
Nearby Homes
- 7873 Gail Dr
- 3816 Saint Johns Terrace
- 7719 Dearborn Ave
- 8390 Wexford Ave
- 3990 Superior Ave
- 4050 O'Leary Ave
- 4123 Hoffman Ave
- 8494 Wexford Ave
- 4104 Estermarie Dr
- 8021 Beech Ave
- 3275 Legacy Trace
- 4106 Orchard Ln
- 4025 Deer Park Ave
- 8608 Dundalk Ct
- 4305 Myrtle Ave
- 13 Wentworth Ln
- 3566 Amberacres Dr
- 4304 Kugler Mill Rd
- 3521 Section Rd
- 4300 Hegner Ave
- 7828 Colton Ln
- 7836 Colton Ln
- 7840 Colton Ln
- 7824 Colton Ln
- 7833 Monterey Ave
- 7837 Monterey Ave
- 7829 Monterey Ave
- 7825 Monterey Ave
- 7820 Colton Ln
- 7844 Colton Ln
- 7837 Colton Ln
- 7841 Colton Ln
- 7833 Colton Ln
- 7845 Colton Ln
- 7845 Monterey Ave
- 7821 Monterey Ave
- 7829 Colton Ln
- 7816 Colton Ln
- 3715 Frontenac Ave
- 7849 Colton Ln
Your Personal Tour Guide
Ask me questions while you tour the home.