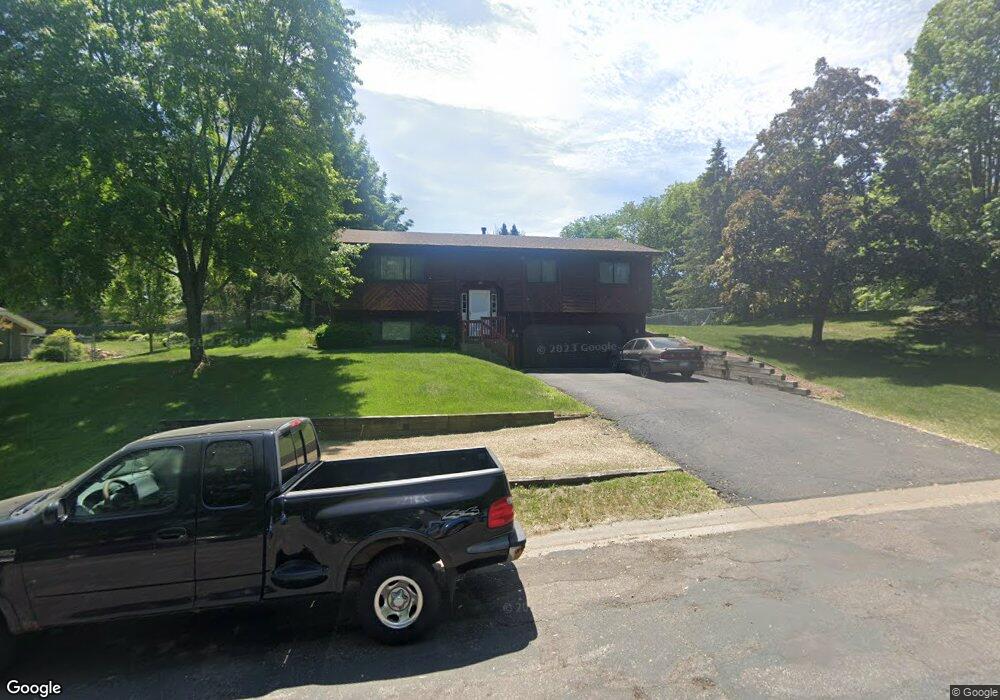
7832 Corey Path Inver Grove Heights, MN 55076
Estimated Value: $371,000 - $407,000
3
Beds
2
Baths
1,276
Sq Ft
$301/Sq Ft
Est. Value
About This Home
This home is located at 7832 Corey Path, Inver Grove Heights, MN 55076 and is currently estimated at $384,009, approximately $300 per square foot. 7832 Corey Path is a home located in Dakota County with nearby schools including Hilltop Elementary School, Inver Grove Heights Middle School, and Simley Senior High School.
Ownership History
Date
Name
Owned For
Owner Type
Purchase Details
Closed on
Jun 7, 2012
Sold by
Rodriguez Antony L and Davison Juliana L
Bought by
Rodriguez Antony L and Davison Juliana L
Current Estimated Value
Home Financials for this Owner
Home Financials are based on the most recent Mortgage that was taken out on this home.
Original Mortgage
$204,120
Outstanding Balance
$112,957
Interest Rate
3.64%
Mortgage Type
New Conventional
Estimated Equity
$271,052
Purchase Details
Closed on
Nov 23, 2004
Sold by
Rogers Gregory E and Rogers Leanne M
Bought by
Rodriguez Anthony L and Davidson Juliana L
Purchase Details
Closed on
May 25, 2000
Sold by
Feiock Douglas W and Feiock Geraldine L
Bought by
Rogers Gregory E and Rogers Leanne M
Create a Home Valuation Report for This Property
The Home Valuation Report is an in-depth analysis detailing your home's value as well as a comparison with similar homes in the area
Home Values in the Area
Average Home Value in this Area
Purchase History
| Date | Buyer | Sale Price | Title Company |
|---|---|---|---|
| Rodriguez Antony L | -- | Accommodation | |
| Rodriguez Anthony L | $234,000 | -- | |
| Rogers Gregory E | $160,400 | -- |
Source: Public Records
Mortgage History
| Date | Status | Borrower | Loan Amount |
|---|---|---|---|
| Open | Rodriguez Antony L | $204,120 |
Source: Public Records
Tax History Compared to Growth
Tax History
| Year | Tax Paid | Tax Assessment Tax Assessment Total Assessment is a certain percentage of the fair market value that is determined by local assessors to be the total taxable value of land and additions on the property. | Land | Improvement |
|---|---|---|---|---|
| 2024 | $3,204 | $329,400 | $82,800 | $246,600 |
| 2023 | $3,204 | $317,700 | $80,700 | $237,000 |
| 2022 | $2,988 | $317,100 | $80,600 | $236,500 |
| 2021 | $2,938 | $278,800 | $70,100 | $208,700 |
| 2020 | $2,700 | $270,200 | $66,800 | $203,400 |
| 2019 | $2,770 | $250,000 | $63,600 | $186,400 |
| 2018 | $2,581 | $239,900 | $60,600 | $179,300 |
| 2017 | $2,344 | $223,800 | $57,700 | $166,100 |
| 2016 | $2,259 | $201,800 | $55,000 | $146,800 |
| 2015 | $2,236 | $176,182 | $48,230 | $127,952 |
| 2014 | -- | $165,173 | $45,896 | $119,277 |
| 2013 | -- | $155,036 | $42,362 | $112,674 |
Source: Public Records
Map
Nearby Homes
- 7996 Corey Path
- 3907 Conroy Trail
- 3901 Conroy Trail
- 3861 Conroy Trail
- 8086 Dana Path
- 3617 76th Ln E
- 4049 75th St E
- 3650 75th St E
- 7614 Connie Ln
- 7944 Charles Way
- 7447 Cloman Way
- 7344 Degrio Way
- 8381 Corcoran Cir Unit 49
- 8406 Copperfield Way Unit 102
- 8404 Copperfield Way Unit 101
- 8336 Cloman Ave
- 7393 Clayton Ave
- 8124 Clifford Cir
- 3085 Upper 76th St E
- 6931 Crosby Ave
- 7834 Corey Path
- 7830 Corey Path
- 3935 79th St E
- 3927 79th St E
- 3949 79th St E
- 7833 Corey Path
- 7846 Corey Path
- 7831 Corey Path
- 7835 Corey Path
- 7874 Corey Path
- 7829 Corey Path
- 7837 Corey Path
- 7840 Dawn Ave
- 3936 79th St E
- 7827 Corey Path
- 7901 Dawn Ave
- 3928 79th St E
- 7839 Corey Path
- 3928 78th St E
- 3912 78th St E