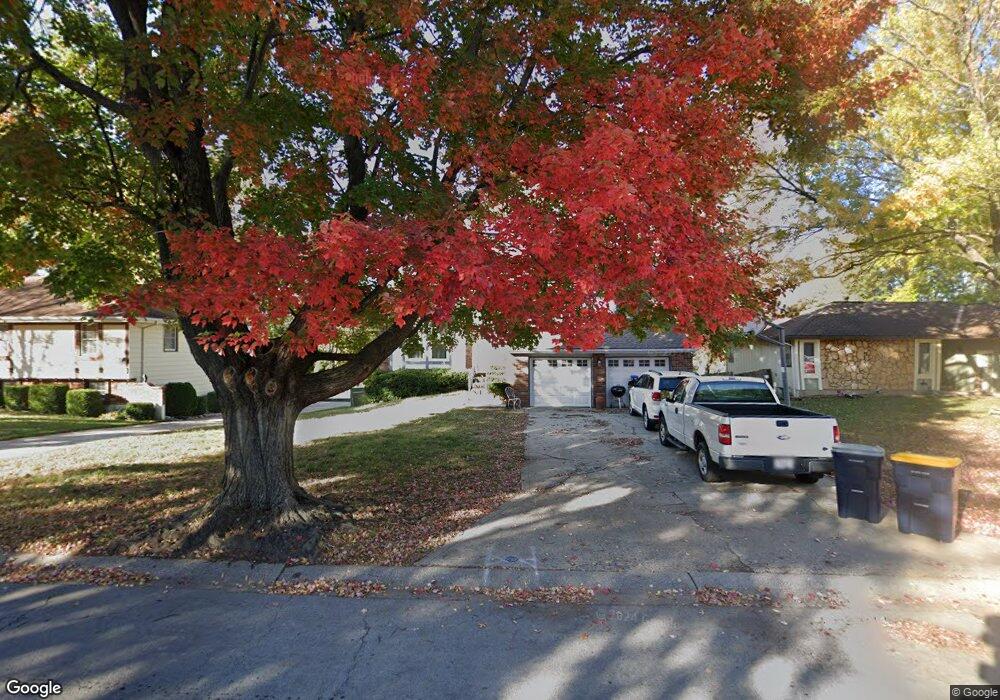
7832 N Euclid Ave Kansas City, MO 64118
Ridgefield NeighborhoodEstimated Value: $276,592 - $300,000
3
Beds
3
Baths
1,186
Sq Ft
$243/Sq Ft
Est. Value
About This Home
This home is located at 7832 N Euclid Ave, Kansas City, MO 64118 and is currently estimated at $288,398, approximately $243 per square foot. 7832 N Euclid Ave is a home located in Clay County with nearby schools including Gashland Elementary School, Clardy Elementary School, and Antioch Middle School.
Ownership History
Date
Name
Owned For
Owner Type
Purchase Details
Closed on
Apr 24, 2024
Sold by
Arnold Carrie and Oconnor Carrie
Bought by
Oconnor Ryan
Current Estimated Value
Purchase Details
Closed on
Nov 10, 2011
Sold by
Rigdon Bill and Rigdon Cheryl L
Bought by
Arnold Carrie and Arnold Craig
Purchase Details
Closed on
Jan 12, 2007
Sold by
Larson Cheryl L and Persell Cheryl L
Bought by
Larson Cheryl L
Home Financials for this Owner
Home Financials are based on the most recent Mortgage that was taken out on this home.
Original Mortgage
$95,188
Interest Rate
6.09%
Mortgage Type
Stand Alone Refi Refinance Of Original Loan
Purchase Details
Closed on
Mar 24, 1998
Sold by
Schwartz Michael R and Schwartz Dana M
Bought by
Persell Cheryl L
Home Financials for this Owner
Home Financials are based on the most recent Mortgage that was taken out on this home.
Original Mortgage
$101,800
Interest Rate
7.08%
Create a Home Valuation Report for This Property
The Home Valuation Report is an in-depth analysis detailing your home's value as well as a comparison with similar homes in the area
Home Values in the Area
Average Home Value in this Area
Purchase History
| Date | Buyer | Sale Price | Title Company |
|---|---|---|---|
| Oconnor Ryan | -- | None Listed On Document | |
| Arnold Carrie | -- | Stewart Title Company Midwes | |
| Larson Cheryl L | -- | Title Enterprises | |
| Persell Cheryl L | -- | Stewart Title |
Source: Public Records
Mortgage History
| Date | Status | Borrower | Loan Amount |
|---|---|---|---|
| Previous Owner | Larson Cheryl L | $95,188 | |
| Previous Owner | Persell Cheryl L | $101,800 |
Source: Public Records
Tax History Compared to Growth
Tax History
| Year | Tax Paid | Tax Assessment Tax Assessment Total Assessment is a certain percentage of the fair market value that is determined by local assessors to be the total taxable value of land and additions on the property. | Land | Improvement |
|---|---|---|---|---|
| 2025 | $2,316 | $30,880 | -- | -- |
| 2024 | $2,316 | $28,750 | -- | -- |
| 2023 | $2,296 | $28,750 | $0 | $0 |
| 2022 | $2,192 | $26,240 | $0 | $0 |
| 2021 | $2,195 | $26,239 | $4,370 | $21,869 |
| 2020 | $2,201 | $24,340 | $0 | $0 |
| 2019 | $2,160 | $24,339 | $4,370 | $19,969 |
| 2018 | $2,183 | $23,500 | $0 | $0 |
| 2017 | $2,045 | $23,500 | $4,370 | $19,130 |
| 2016 | $2,045 | $22,420 | $4,750 | $17,670 |
| 2015 | $2,044 | $22,420 | $4,750 | $17,670 |
| 2014 | $2,075 | $22,420 | $4,750 | $17,670 |
Source: Public Records
Map
Nearby Homes
- 1615 NE 78th St
- 7824 N Park Ave
- 8009 N Brooklyn Ave
- 7802 N Wayne Ave
- 1416 NE 79th St
- 1707 NE 76th Terrace
- 8032 N Brooklyn Ave
- 1611 NE 80th Place
- 7609 N Park Ave
- 1732 NE 80th Place
- 7804 N Lydia Ave
- 1305 NE 79th St
- 2605 NE 78th St
- 8017 N Tracy Ave
- 7515 N Wayne Ave
- 1600 NE 81st St
- 7937 N Forest Ave
- 7605 N Chestnut Ave
- 7421 N Wabash Ave
- 1206 NE 81st Terrace
- 7828 N Euclid Ave
- 7836 N Euclid Ave
- 7824 N Euclid Ave
- 7900 N Euclid Ave
- 7829 N Michigan Ave
- 7833 N Michigan Ave
- 7825 N Michigan Ave
- 7901 N Michigan Ave
- 7904 N Euclid Ave
- 7821 N Michigan Ave
- 7833 N Euclid Ave
- 7837 N Euclid Ave
- 7829 N Euclid Ave
- 7905 N Michigan Ave
- 7901 N Euclid Ave
- 7818 N Euclid Ave
- 7817 N Michigan Ave
- 7908 N Euclid Ave
- 7825 N Euclid Ave