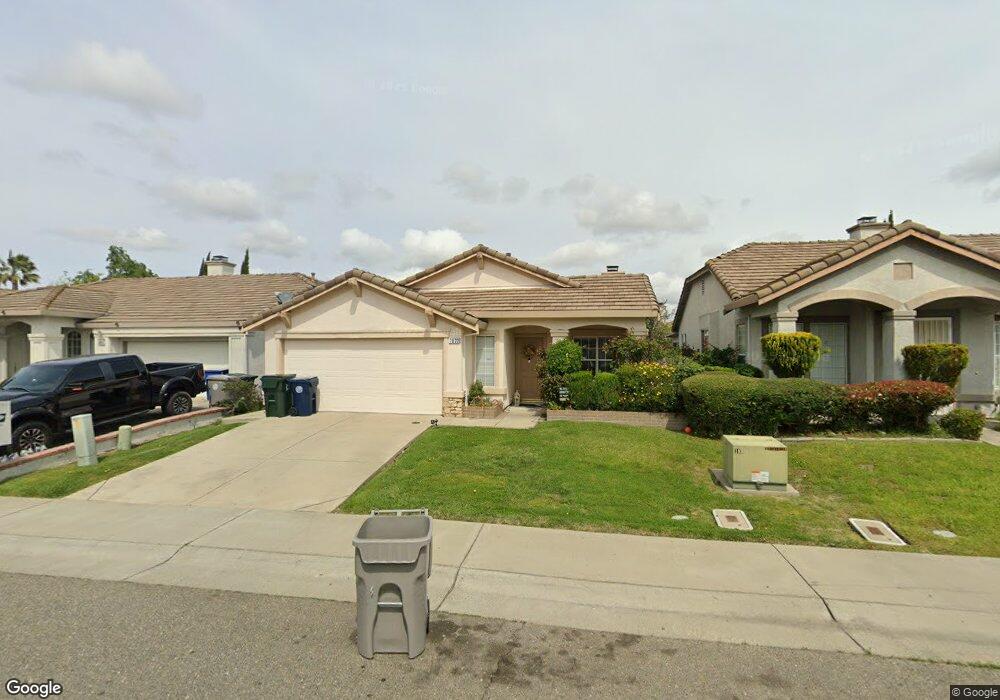
7833 Calzada Way Elk Grove, CA 95758
North Laguna NeighborhoodEstimated Value: $468,896 - $530,000
3
Beds
2
Baths
1,329
Sq Ft
$376/Sq Ft
Est. Value
About This Home
This home is located at 7833 Calzada Way, Elk Grove, CA 95758 and is currently estimated at $499,474, approximately $375 per square foot. 7833 Calzada Way is a home located in Sacramento County with nearby schools including Irene B. West Elementary School, Edward Harris Jr. Middle School, and Monterey Trail High School.
Ownership History
Date
Name
Owned For
Owner Type
Purchase Details
Closed on
Mar 28, 2003
Sold by
Ralls Ernest J
Bought by
Murphy Ronald D and Murphy Christine D
Current Estimated Value
Purchase Details
Closed on
Nov 20, 2000
Sold by
Mata Raul M and Mata Nila C
Bought by
Ralls Ernest J
Home Financials for this Owner
Home Financials are based on the most recent Mortgage that was taken out on this home.
Original Mortgage
$110,000
Interest Rate
7.86%
Purchase Details
Closed on
Oct 21, 1999
Sold by
J & L Properties
Bought by
Mata Raul M and Mata Nila C
Home Financials for this Owner
Home Financials are based on the most recent Mortgage that was taken out on this home.
Original Mortgage
$77,950
Interest Rate
7.75%
Create a Home Valuation Report for This Property
The Home Valuation Report is an in-depth analysis detailing your home's value as well as a comparison with similar homes in the area
Home Values in the Area
Average Home Value in this Area
Purchase History
| Date | Buyer | Sale Price | Title Company |
|---|---|---|---|
| Murphy Ronald D | $240,000 | First American Title Company | |
| Ralls Ernest J | -- | First American Title Company | |
| Ralls Ernest J | $175,000 | First American Title Ins Co | |
| Mata Raul M | $156,000 | Stewart Title |
Source: Public Records
Mortgage History
| Date | Status | Borrower | Loan Amount |
|---|---|---|---|
| Previous Owner | Ralls Ernest J | $110,000 | |
| Previous Owner | Mata Raul M | $77,950 |
Source: Public Records
Tax History Compared to Growth
Tax History
| Year | Tax Paid | Tax Assessment Tax Assessment Total Assessment is a certain percentage of the fair market value that is determined by local assessors to be the total taxable value of land and additions on the property. | Land | Improvement |
|---|---|---|---|---|
| 2025 | $3,879 | $347,577 | $57,921 | $289,656 |
| 2024 | $3,879 | $340,763 | $56,786 | $283,977 |
| 2023 | $3,779 | $334,082 | $55,673 | $278,409 |
| 2022 | $3,713 | $327,532 | $54,582 | $272,950 |
| 2021 | $3,669 | $321,111 | $53,512 | $267,599 |
| 2020 | $3,617 | $317,820 | $52,964 | $264,856 |
| 2019 | $3,551 | $311,589 | $51,926 | $259,663 |
| 2018 | $3,454 | $305,480 | $50,908 | $254,572 |
| 2017 | $3,392 | $299,491 | $49,910 | $249,581 |
| 2016 | $3,220 | $293,620 | $48,932 | $244,688 |
| 2015 | $3,044 | $278,038 | $46,335 | $231,703 |
| 2014 | $2,892 | $262,300 | $43,712 | $218,588 |
Source: Public Records
Map
Nearby Homes
- 7400 Shasta Ave
- 0 Shasta Ave
- 8465 Viborg Ln
- 8461 Viborg Ln
- 8457 Viborg Ln
- 8464 Viborg Ln
- 8460 Viborg Ln
- 8456 Viborg Ln
- Plan 3 at Camellia Place
- Plan 1 at Camellia Place
- Plan 2 at Camellia Place
- Plan 1 at Courtyards at Cotton - Courtyards at Cotton Lane
- 7715 Cotton Ln
- 220 Cicero Cir
- 130 Bywell Bridge Cir
- 7481 Splendid Way
- 6880 Calvine Rd
- 6892 Calvine Rd
- 6856 Calvine Rd
- 18 Seasmoke Place
- 7837 Calzada Way
- 7829 Calzada Way
- 7825 Calzada Way
- 7841 Calzada Way
- 8539 Tambor Way
- 8543 Tambor Way
- 8535 Tambor Way
- 8547 Tambor Way
- 7832 Calzada Way
- 7845 Calzada Way
- 7821 Calzada Way
- 7828 Calzada Way
- 8531 Tambor Way
- 7836 Calzada Way
- 7824 Calzada Way
- 8551 Tambor Way
- 7840 Calzada Way
- 8525 Tambor Way
- 7849 Calzada Way
- 7820 Calzada Way