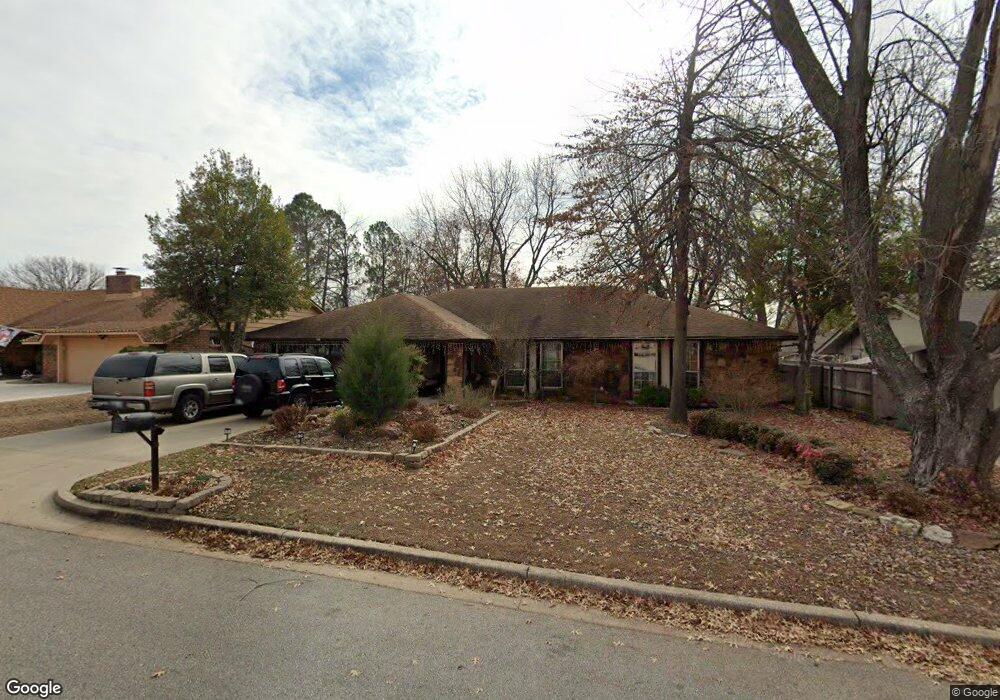
7834 E 79th St Tulsa, OK 74133
Sheridan Valley NeighborhoodEstimated Value: $230,144 - $281,000
Studio
2
Baths
2,159
Sq Ft
$119/Sq Ft
Est. Value
About This Home
This home is located at 7834 E 79th St, Tulsa, OK 74133 and is currently estimated at $256,786, approximately $118 per square foot. 7834 E 79th St is a home located in Tulsa County with nearby schools including Jarman Elementary School, Union 6th-7th Grade Center, and Union 8th Grade Center.
Ownership History
Date
Name
Owned For
Owner Type
Purchase Details
Closed on
Oct 3, 2018
Sold by
Spoon Dylan T
Bought by
Spoon Jimmy D
Current Estimated Value
Purchase Details
Closed on
Oct 2, 2018
Sold by
Spoon Jimmy
Bought by
Spoon Jimmy D
Purchase Details
Closed on
Aug 7, 2018
Sold by
Mcfarland Stephen J
Bought by
Spoon Jimmy D and Spoon Dylan T
Purchase Details
Closed on
Jan 20, 2011
Sold by
Mcfarland Stephen J and Mcfarland Stephen James
Bought by
Mcfarland Stephen and The Stephen Mcfarland Revocable Trust
Purchase Details
Closed on
Jan 8, 1998
Sold by
Mcfarland Stephene W
Bought by
Mcfarland Stephen J
Purchase Details
Closed on
Sep 29, 1997
Sold by
Young Kim Kee Cho and Young Kim Seok
Bought by
Mcfarland Stephen J and Mcfarland Stephene W
Home Financials for this Owner
Home Financials are based on the most recent Mortgage that was taken out on this home.
Original Mortgage
$88,065
Interest Rate
7.49%
Mortgage Type
Purchase Money Mortgage
Create a Home Valuation Report for This Property
The Home Valuation Report is an in-depth analysis detailing your home's value as well as a comparison with similar homes in the area
Home Values in the Area
Average Home Value in this Area
Purchase History
| Date | Buyer | Sale Price | Title Company |
|---|---|---|---|
| Spoon Jimmy D | -- | None Available | |
| Spoon Jimmy D | -- | None Available | |
| Spoon Jimmy D | -- | None Available | |
| Mcfarland Stephen | -- | None Available | |
| Mcfarland Stephen J | -- | -- | |
| Mcfarland Stephen J | $93,000 | Century Title & Escrow |
Source: Public Records
Mortgage History
| Date | Status | Borrower | Loan Amount |
|---|---|---|---|
| Previous Owner | Mcfarland Stephen J | $88,065 |
Source: Public Records
Tax History
| Year | Tax Paid | Tax Assessment Tax Assessment Total Assessment is a certain percentage of the fair market value that is determined by local assessors to be the total taxable value of land and additions on the property. | Land | Improvement |
|---|---|---|---|---|
| 2025 | $2,813 | $20,571 | $2,226 | $18,345 |
| 2024 | $2,386 | $19,591 | $2,040 | $17,551 |
| 2023 | $2,386 | $18,659 | $2,193 | $16,466 |
| 2022 | $2,367 | $17,769 | $2,821 | $14,948 |
| 2021 | $2,284 | $16,923 | $2,687 | $14,236 |
| 2020 | $2,144 | $16,117 | $2,559 | $13,558 |
| 2019 | $2,113 | $15,350 | $2,437 | $12,913 |
| 2018 | $1,870 | $13,619 | $2,765 | $10,854 |
| 2017 | $1,823 | $14,193 | $2,882 | $11,311 |
| 2016 | $1,752 | $13,968 | $2,836 | $11,132 |
| 2015 | $1,715 | $14,193 | $2,882 | $11,311 |
| 2014 | $1,635 | $13,167 | $2,882 | $10,285 |
Source: Public Records
Map
Nearby Homes
- 7802 E 79th St
- 8019 S 77th East Ave
- 7606 E 77th St
- 7830 S 85th East Ave
- 8323 E 81st Place
- 8507 E 78th St
- 8509 E 78th Place
- 7932 S 86th East Ave
- 8126 E 74th Ct
- 7127 E 80th St
- 8212 S 74th East Ave
- 8229 S 74th East Ave
- 8410 E 74th Ct
- 7912 S 87th East Ave
- 8428 S 84th East Ave
- 7409 S 84th East Ave
- 7805 S 70th East Ave
- 8421 S 84th East Place
- 8007 S 88th East Ave
- 7936 S 90th East Ave
- 7840 E 79th St
- 7828 E 79th St
- 7833 E 79th Place
- 7827 E 79th Place
- 7837 E 79th Place
- 7822 E 79th St
- 7848 E 79th St
- 7835 E 79th St
- 7841 E 79th St
- 7821 E 79th Place
- 7829 E 79th St
- 7845 E 79th Place
- 7849 E 79th St
- 7816 E 79th St
- 7823 E 79th St
- 7854 E 79th St
- 7815 E 79th Place
- 7851 E 79th Place
- 7817 E 79th St
- 7904 E 78th St
Your Personal Tour Guide
Ask me questions while you tour the home.