Estimated Value: $102,000 - $123,019
1
Bed
1
Bath
595
Sq Ft
$195/Sq Ft
Est. Value
About This Home
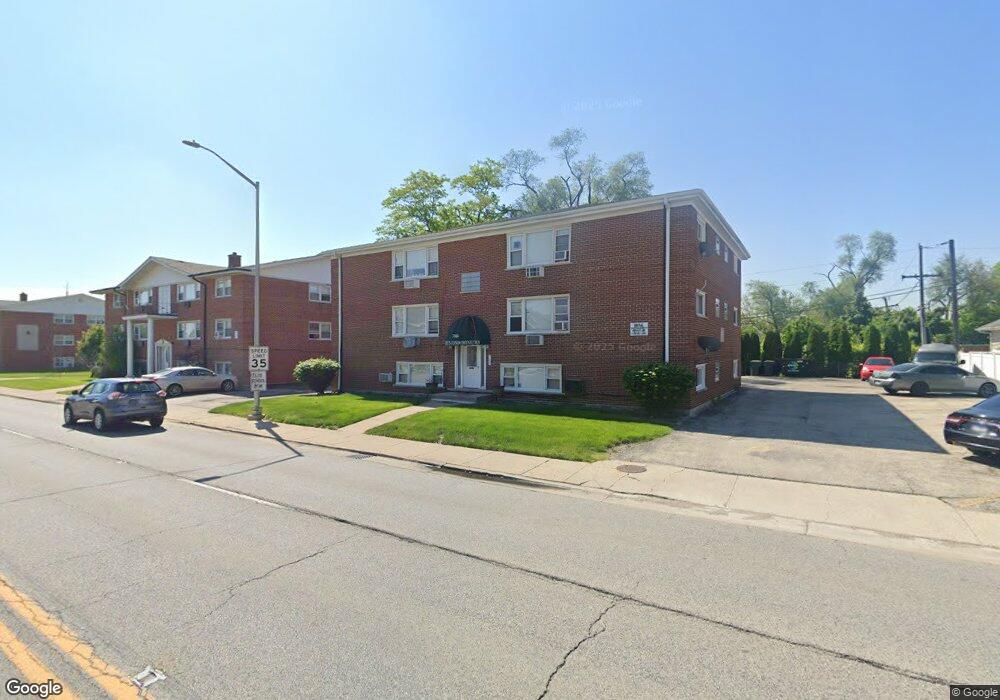
This home is located at 7835 43rd St Unit 4, Lyons, IL 60534 and is currently estimated at $116,005, approximately $194 per square foot. 7835 43rd St Unit 4 is a home located in Cook County with nearby schools including J W Robinson Jr Elementary School, George Washington Middle School, and J. Sterling Morton High School West.
Ownership History
Date
Name
Owned For
Owner Type
Purchase Details
Closed on
Dec 12, 2008
Sold by
Pinal Baldemar and Rincon Araceli
Bought by
Pinal Baldemar
Current Estimated Value
Home Financials for this Owner
Home Financials are based on the most recent Mortgage that was taken out on this home.
Original Mortgage
$60,000
Outstanding Balance
$39,486
Interest Rate
6.3%
Mortgage Type
Stand Alone Refi Refinance Of Original Loan
Estimated Equity
$76,519
Purchase Details
Closed on
Feb 20, 2004
Sold by
Kopchar John
Bought by
Pinal Baldemar and Pinal Baldemar
Home Financials for this Owner
Home Financials are based on the most recent Mortgage that was taken out on this home.
Original Mortgage
$72,200
Interest Rate
5.74%
Mortgage Type
FHA
Purchase Details
Closed on
Apr 17, 1999
Sold by
Citizens Bank Illinois Na
Bought by
Kopchar John
Home Financials for this Owner
Home Financials are based on the most recent Mortgage that was taken out on this home.
Original Mortgage
$56,500
Interest Rate
6.94%
Mortgage Type
Purchase Money Mortgage
Create a Home Valuation Report for This Property
The Home Valuation Report is an in-depth analysis detailing your home's value as well as a comparison with similar homes in the area
Home Values in the Area
Average Home Value in this Area
Purchase History
| Date | Buyer | Sale Price | Title Company |
|---|---|---|---|
| Pinal Baldemar | -- | Ticor Title Insurance Co | |
| Pinal Baldemar | $74,000 | Multiple | |
| Kopchar John | $58,000 | -- |
Source: Public Records
Mortgage History
| Date | Status | Borrower | Loan Amount |
|---|---|---|---|
| Open | Pinal Baldemar | $60,000 | |
| Closed | Pinal Baldemar | $72,200 | |
| Previous Owner | Kopchar John | $56,500 |
Source: Public Records
Tax History
| Year | Tax Paid | Tax Assessment Tax Assessment Total Assessment is a certain percentage of the fair market value that is determined by local assessors to be the total taxable value of land and additions on the property. | Land | Improvement |
|---|---|---|---|---|
| 2025 | $1,371 | $7,849 | $542 | $7,307 |
| 2024 | $1,371 | $7,849 | $542 | $7,307 |
| 2023 | $197 | $7,849 | $542 | $7,307 |
| 2022 | $197 | $3,964 | $683 | $3,281 |
| 2021 | $218 | $3,963 | $683 | $3,280 |
| 2020 | $298 | $3,963 | $683 | $3,280 |
| 2019 | $1,056 | $6,171 | $612 | $5,559 |
| 2018 | $1,030 | $6,171 | $612 | $5,559 |
| 2017 | $1,013 | $6,171 | $612 | $5,559 |
| 2016 | $1,262 | $5,739 | $541 | $5,198 |
| 2015 | $1,186 | $5,739 | $541 | $5,198 |
| 2014 | $1,165 | $5,739 | $541 | $5,198 |
Source: Public Records
Map
Nearby Homes
- 4332 Amelia Ave
- 7700 Joliet Rd
- 4350 Elm Ave
- 4252 Prescott Ave
- 4223 Elm Ave
- 4313 Elm Ave
- 4147 Amelia Ave
- 4129 Gage Ave
- 4446 Gage Ave
- 4322 Oak Ave
- 7911 45th St
- 4448 Joliet Ave
- 7731 45th Place
- 4617 Joliet Ave
- 8047 45th Place
- 4448 Lawndale Ave
- 8245 43rd Place
- 8244 44th St
- 4608 Hawthorne Ave
- 4539 Clyde Ave
- 7835 43rd St Unit 6
- 7835 43rd St Unit 2
- 7835 43rd St Unit 7
- 7835 43rd St Unit 5
- 7835 43rd St Unit 1
- 7835 43rd St Unit 10
- 7835 43rd St Unit 9
- 7835 43rd St Unit 8
- 7835 43rd St Unit 3
- 4320 Center Ave
- 7831 43rd St Unit 4C
- 7831 43rd St Unit 3C
- 7831 43rd St Unit 2C
- 7831 43rd St Unit 1C
- 7831 43rd St Unit 4B
- 7831 43rd St Unit 1B
- 7831 43rd St Unit 3A
- 7831 43rd St Unit 2A
- 7831 43rd St Unit 1A
- 7831 43rd St Unit 3B
Your Personal Tour Guide
Ask me questions while you tour the home.