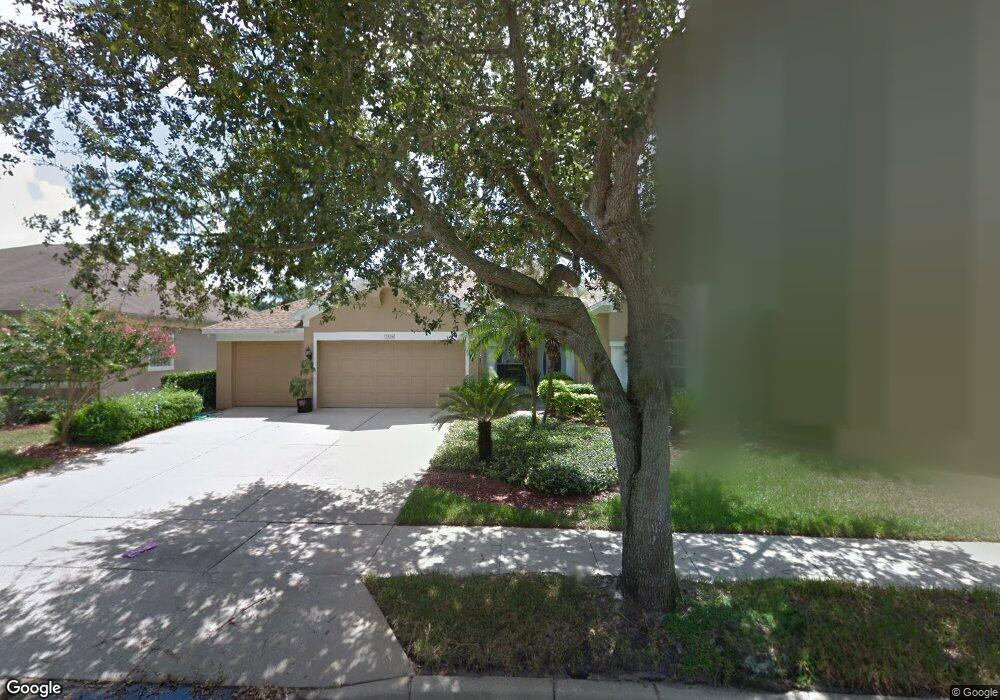
7836 Saint Andrews Cir Orlando, FL 32835
MetroWest NeighborhoodEstimated Value: $575,049 - $761,000
4
Beds
3
Baths
2,367
Sq Ft
$263/Sq Ft
Est. Value
About This Home
This home is located at 7836 Saint Andrews Cir, Orlando, FL 32835 and is currently estimated at $623,512, approximately $263 per square foot. 7836 Saint Andrews Cir is a home located in Orange County with nearby schools including Westpointe Elementary, Gotha Middle School, and Olympia High.
Ownership History
Date
Name
Owned For
Owner Type
Purchase Details
Closed on
Jul 19, 2000
Sold by
Musselman Eric P and Wikle-Musselman Wendy
Bought by
Costa Jason and Costa Rachel
Current Estimated Value
Home Financials for this Owner
Home Financials are based on the most recent Mortgage that was taken out on this home.
Original Mortgage
$180,000
Interest Rate
8.3%
Mortgage Type
New Conventional
Purchase Details
Closed on
Sep 22, 1998
Sold by
Raymond W Franklin Tr
Bought by
Musselman Eric P and Wikle-Musselman Wendy
Home Financials for this Owner
Home Financials are based on the most recent Mortgage that was taken out on this home.
Original Mortgage
$168,000
Interest Rate
6.95%
Mortgage Type
New Conventional
Purchase Details
Closed on
Nov 30, 1994
Sold by
Pulte Home Corp
Bought by
Franklin Raymond W
Home Financials for this Owner
Home Financials are based on the most recent Mortgage that was taken out on this home.
Original Mortgage
$140,500
Interest Rate
9.23%
Create a Home Valuation Report for This Property
The Home Valuation Report is an in-depth analysis detailing your home's value as well as a comparison with similar homes in the area
Home Values in the Area
Average Home Value in this Area
Purchase History
| Date | Buyer | Sale Price | Title Company |
|---|---|---|---|
| Costa Jason | $235,000 | -- | |
| Musselman Eric P | $210,000 | -- | |
| Franklin Raymond W | $210,600 | -- |
Source: Public Records
Mortgage History
| Date | Status | Borrower | Loan Amount |
|---|---|---|---|
| Open | Musselman Eric P | $188,684 | |
| Closed | Musselman Eric P | $180,000 | |
| Previous Owner | Musselman Eric P | $168,000 | |
| Previous Owner | Franklin Raymond W | $140,500 |
Source: Public Records
Tax History Compared to Growth
Tax History
| Year | Tax Paid | Tax Assessment Tax Assessment Total Assessment is a certain percentage of the fair market value that is determined by local assessors to be the total taxable value of land and additions on the property. | Land | Improvement |
|---|---|---|---|---|
| 2025 | $3,928 | $253,487 | -- | -- |
| 2024 | $3,724 | $253,487 | -- | -- |
| 2023 | $3,724 | $239,168 | $0 | $0 |
| 2022 | $3,607 | $232,202 | $0 | $0 |
| 2021 | $3,544 | $225,439 | $0 | $0 |
| 2020 | $3,371 | $222,326 | $0 | $0 |
| 2019 | $3,469 | $217,327 | $0 | $0 |
| 2018 | $3,431 | $213,275 | $0 | $0 |
| 2017 | $3,382 | $290,671 | $50,000 | $240,671 |
| 2016 | $3,363 | $279,654 | $45,000 | $234,654 |
| 2015 | $3,412 | $265,429 | $45,000 | $220,429 |
| 2014 | $3,415 | $229,561 | $43,000 | $186,561 |
Source: Public Records
Map
Nearby Homes
- 7766 Bardmoor Hill Cir
- 2117 Saint Andrews Cir
- 7727 Glynde Hill Dr
- 7895 Saint Giles Place
- 1731 Knotting Hill Dr
- 7724 Belvoir Dr
- 7900 Saint Giles Place
- 8040 Saint Andrews Cir Unit 5
- 7670 Milano Dr
- 7698 Mount Carmel Dr
- 7733 Belvoir Dr
- 1706 Cheltenborough Dr
- 7613 Torino Ct
- 1805 Westpointe Cir
- 2225 Kettle Dr
- 1867 Verde Way
- 1808 Westpointe Cir
- 2237 Baesel View Dr
- 1906 Chathamoor Dr
- 2232 Lake Vilma Dr
- 7830 Circle
- 7830 Saint Andrews Cir
- 7842 Saint Andrews Cir
- 7831 Saint Giles Place
- 7839 Saint Giles Place
- 7823 Saint Giles Place
- 7824 Saint Andrews Cir
- 7850 Saint Andrews Cir
- 7849 Saint Andrews Cir
- 7855 Saint Andrews Cir
- 7815 Saint Giles Place
- 7847 Saint Giles Place
- 7843 Saint Andrews Cir
- 7861 Saint Andrews Cir
- 7818 Saint Andrews Cir
- 7856 Saint Andrews Cir
- 7807 Saint Giles Place
- 7837 Saint Andrews Cir Unit 5
- 7855 Saint Giles Place
- 7867 Saint Andrews Cir