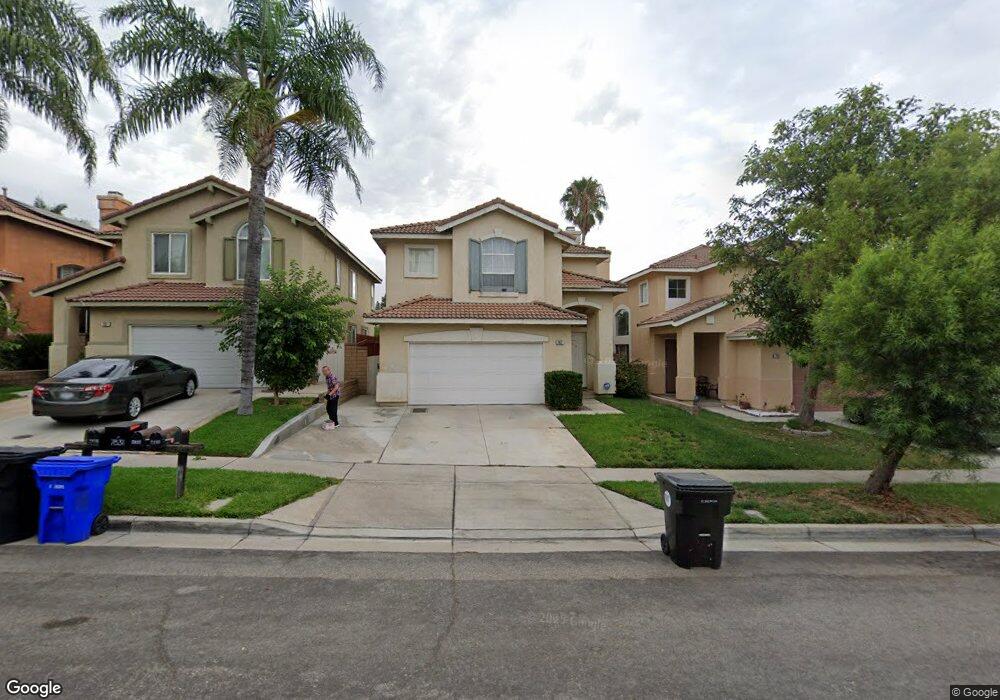
7837 Danner Ct Rancho Cucamonga, CA 91730
Terra Vista NeighborhoodEstimated Value: $706,519 - $765,000
3
Beds
3
Baths
1,676
Sq Ft
$443/Sq Ft
Est. Value
About This Home
This home is located at 7837 Danner Ct, Rancho Cucamonga, CA 91730 and is currently estimated at $741,880, approximately $442 per square foot. 7837 Danner Ct is a home located in San Bernardino County with nearby schools including Coyote Canyon Elementary, Ruth Musser Middle, and Rancho Cucamonga High School.
Ownership History
Date
Name
Owned For
Owner Type
Purchase Details
Closed on
Jan 27, 2014
Sold by
Ling Kum Kenny
Bought by
Sunrise Management Group Llc
Current Estimated Value
Purchase Details
Closed on
Oct 25, 2001
Sold by
Kum Kenny
Bought by
Ling Kum Kenny and Ling Kum Miu
Purchase Details
Closed on
Jan 11, 2001
Sold by
Kum Miu Ling
Bought by
Kum Kenny
Home Financials for this Owner
Home Financials are based on the most recent Mortgage that was taken out on this home.
Original Mortgage
$144,000
Interest Rate
7.08%
Purchase Details
Closed on
May 22, 1998
Sold by
Lewis Development Co
Bought by
Albizu Francisco Javier
Home Financials for this Owner
Home Financials are based on the most recent Mortgage that was taken out on this home.
Original Mortgage
$155,790
Interest Rate
6.9%
Mortgage Type
FHA
Create a Home Valuation Report for This Property
The Home Valuation Report is an in-depth analysis detailing your home's value as well as a comparison with similar homes in the area
Home Values in the Area
Average Home Value in this Area
Purchase History
| Date | Buyer | Sale Price | Title Company |
|---|---|---|---|
| Sunrise Management Group Llc | -- | None Available | |
| Ling Kum Kenny | -- | Old Republic Title Company | |
| Kum Kenny | -- | Old Republic Title | |
| Kum Kenny | $204,000 | Old Republic Title | |
| Albizu Francisco Javier | $170,000 | Chicago Title |
Source: Public Records
Mortgage History
| Date | Status | Borrower | Loan Amount |
|---|---|---|---|
| Previous Owner | Kum Kenny | $144,000 | |
| Previous Owner | Albizu Francisco Javier | $155,790 |
Source: Public Records
Tax History
| Year | Tax Paid | Tax Assessment Tax Assessment Total Assessment is a certain percentage of the fair market value that is determined by local assessors to be the total taxable value of land and additions on the property. | Land | Improvement |
|---|---|---|---|---|
| 2025 | $6,235 | $501,379 | $175,299 | $326,080 |
| 2024 | $6,063 | $491,548 | $171,862 | $319,686 |
| 2023 | $5,913 | $481,910 | $168,492 | $313,418 |
| 2022 | $5,798 | $472,461 | $165,188 | $307,273 |
| 2021 | $5,797 | $463,197 | $161,949 | $301,248 |
| 2020 | $5,648 | $458,447 | $160,288 | $298,159 |
| 2019 | $5,624 | $449,458 | $157,145 | $292,313 |
| 2018 | $5,482 | $440,645 | $154,064 | $286,581 |
| 2017 | $5,393 | $432,005 | $151,043 | $280,962 |
| 2016 | $5,357 | $423,534 | $148,081 | $275,453 |
| 2015 | $5,296 | $417,172 | $145,857 | $271,315 |
| 2014 | $3,394 | $250,762 | $62,691 | $188,071 |
Source: Public Records
Map
Nearby Homes
- 11090 Mountain View Dr Unit 74
- 11450 Church St Unit 63
- 11450 Church St Unit 23
- 7609 Belpine Place
- 11159 Saint Tropez Dr
- 11261 Terra Vista Pkwy
- 7518 Hardy Ave
- 11220 Terra Vista Pkwy Unit 94
- 7373 Glenview Place
- 7523 Wellington Place
- 7331 Belpine Place Unit 30
- 7803 Paxton Place
- 10591 Huxley Dr
- 10751 Spyglass Dr
- 10532 Wilding Dr
- 10557 Huxley Dr
- 7487 Holloway Rd
- 7774 Haywood Place
- 7784 Haywood Place
- 7353 Ellena W Unit 70
- 7831 Danner Ct
- 7849 Danner Ct
- 7825 Danner Ct
- 7855 Danner Ct
- 7819 Danner Ct
- 11076 De Anza Dr
- 7813 Danner Ct
- 7861 Danner Ct
- 7832 Danner Ct
- 11070 De Anza Dr
- 7826 Danner Ct
- 7807 Danner Ct
- 7820 Danner Ct
- 11064 De Anza Dr
- 7801 Danner Ct
- 7814 Danner Ct
- 7833 Emery Place
- 11058 De Anza Dr
- 7808 Danner Ct
- 7827 Emery Place
Your Personal Tour Guide
Ask me questions while you tour the home.