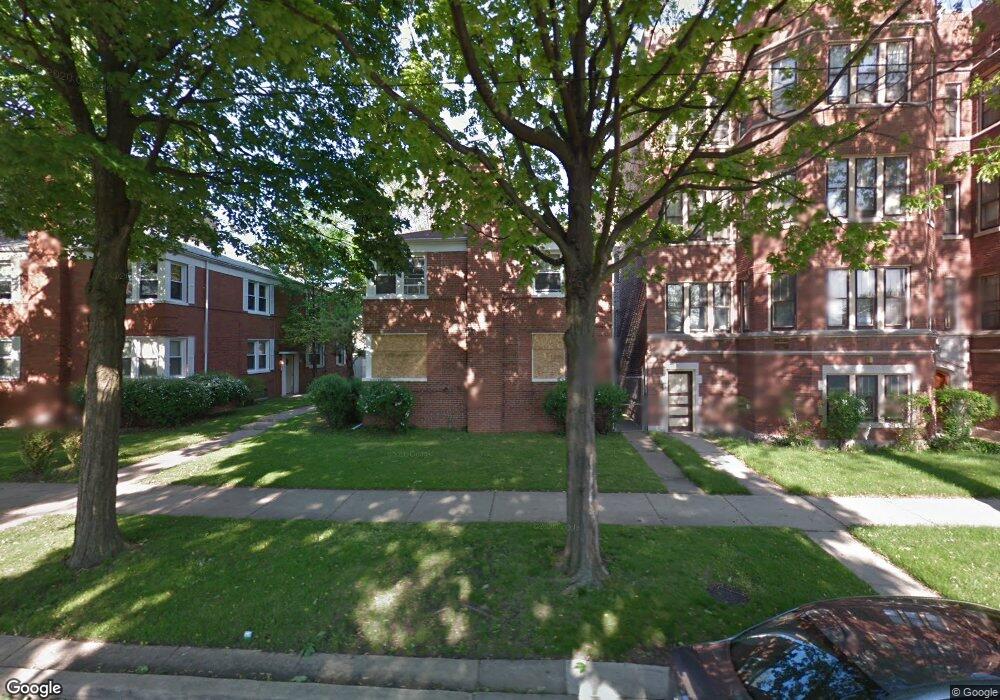
7837 S Paxton Ave Unit 2W Chicago, IL 60649
South Shore NeighborhoodEstimated Value: $78,270 - $152,000
2
Beds
1
Bath
950
Sq Ft
$124/Sq Ft
Est. Value
About This Home
This home is located at 7837 S Paxton Ave Unit 2W, Chicago, IL 60649 and is currently estimated at $117,818, approximately $124 per square foot. 7837 S Paxton Ave Unit 2W is a home located in Cook County with nearby schools including Mann Elementary School and Great Lakes Academy.
Ownership History
Date
Name
Owned For
Owner Type
Purchase Details
Closed on
Jan 15, 2010
Sold by
Deutsche Bank National Trust Company
Bought by
Young Ruth L
Current Estimated Value
Purchase Details
Closed on
Oct 15, 2009
Sold by
Smith Sophia and Indymac Federal Bank Fsb
Bought by
Deutsche Bank National Trust Company
Purchase Details
Closed on
Feb 19, 2007
Sold by
Patterson Lawrence and Patterson Annette
Bought by
Smith Sophia
Home Financials for this Owner
Home Financials are based on the most recent Mortgage that was taken out on this home.
Original Mortgage
$126,000
Interest Rate
7.75%
Mortgage Type
Balloon
Purchase Details
Closed on
Jun 4, 1996
Sold by
Beverly Trust Company
Bought by
Patterson Lawrence and Patterson Annette
Home Financials for this Owner
Home Financials are based on the most recent Mortgage that was taken out on this home.
Original Mortgage
$23,100
Interest Rate
8.29%
Create a Home Valuation Report for This Property
The Home Valuation Report is an in-depth analysis detailing your home's value as well as a comparison with similar homes in the area
Home Values in the Area
Average Home Value in this Area
Purchase History
| Date | Buyer | Sale Price | Title Company |
|---|---|---|---|
| Young Ruth L | $14,000 | Ticor | |
| Deutsche Bank National Trust Company | -- | None Available | |
| Smith Sophia | $126,000 | Pntn | |
| Patterson Lawrence | $26,500 | -- |
Source: Public Records
Mortgage History
| Date | Status | Borrower | Loan Amount |
|---|---|---|---|
| Previous Owner | Smith Sophia | $126,000 | |
| Previous Owner | Patterson Lawrence | $23,100 |
Source: Public Records
Tax History Compared to Growth
Tax History
| Year | Tax Paid | Tax Assessment Tax Assessment Total Assessment is a certain percentage of the fair market value that is determined by local assessors to be the total taxable value of land and additions on the property. | Land | Improvement |
|---|---|---|---|---|
| 2024 | $529 | $7,422 | $1,031 | $6,391 |
| 2023 | $514 | $2,500 | $1,250 | $1,250 |
| 2022 | $514 | $2,500 | $1,250 | $1,250 |
| 2021 | $503 | $2,499 | $1,249 | $1,250 |
| 2020 | $1,840 | $8,258 | $1,237 | $7,021 |
| 2019 | $1,836 | $9,140 | $1,237 | $7,903 |
| 2018 | $1,805 | $9,140 | $1,237 | $7,903 |
| 2017 | $1,574 | $7,312 | $1,100 | $6,212 |
| 2016 | $1,465 | $7,312 | $1,100 | $6,212 |
| 2015 | $1,340 | $7,312 | $1,100 | $6,212 |
| 2014 | $1,367 | $7,369 | $928 | $6,441 |
| 2013 | $1,340 | $7,369 | $928 | $6,441 |
Source: Public Records
Map
Nearby Homes
- 7847 S Paxton Ave
- 7830 S Merrill Ave
- 7919 S Merrill Ave
- 7930 S Luella Ave
- 7937 S Luella Ave
- 7940 S Crandon Ave
- 7733 S Luella Ave
- 7834 S Oglesby Ave
- 7723 S Paxton Ave
- 7716 S Paxton Ave
- 7741 S Clyde Ave
- 7947 S Clyde Ave
- 8015 S Paxton Ave
- 7955 S Chappel Ave
- 8040 S Luella Ave
- 7643 S Paxton Ave
- 7845 S Yates Blvd
- 7715 S Oglesby Ave
- 8051 S Paxton Ave
- 7642 S Merrill Ave
- 7837 S Paxton Ave Unit 1E
- 7837 S Paxton Ave Unit 1W
- 7837 S Paxton Ave Unit 2E
- 7839 S Paxton Ave
- 7833 S Paxton Ave Unit 2
- 7843 S Paxton Ave Unit 3
- 7843 S Paxton Ave Unit 2
- 7827 S Paxton Ave
- 7847 S Paxton Ave
- 7825 S Paxton Ave Unit 3
- 7825 S Paxton Ave Unit 1
- 7825 S Paxton Ave
- 7830 S Luella Ave Unit 3S
- 7830 S Luella Ave Unit 2N
- 7826 S Luella Ave
- 2200 E 79th St
- 7822 S Luella Ave
- 7832 S Luella Ave Unit 3N
- 7832 S Luella Ave
- 7821 S Paxton Ave Unit 1