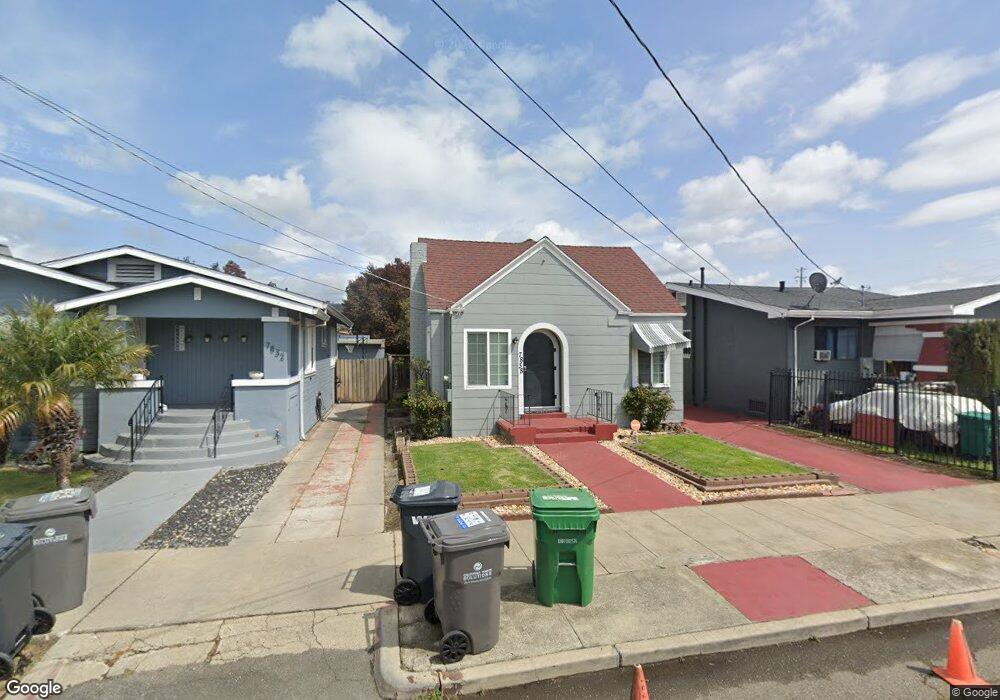
7838 Ash St Oakland, CA 94621
Arroyo Viejo NeighborhoodEstimated Value: $341,000 - $414,000
2
Beds
1
Bath
792
Sq Ft
$466/Sq Ft
Est. Value
About This Home
This home is located at 7838 Ash St, Oakland, CA 94621 and is currently estimated at $369,074, approximately $466 per square foot. 7838 Ash St is a home located in Alameda County with nearby schools including East Oakland Pride Elementary School, Greenleaf Elementary School, and Coliseum College Prep Academy.
Ownership History
Date
Name
Owned For
Owner Type
Purchase Details
Closed on
Jul 6, 2016
Sold by
Galloway Dorothy M
Bought by
Galloway Dorothy M and The Dorothy M Galloway Revocab
Current Estimated Value
Purchase Details
Closed on
Mar 8, 2002
Sold by
Galloway Dorothy M
Bought by
Galloway Dorothy M and Galloway Carrington L
Purchase Details
Closed on
Feb 4, 1998
Sold by
Benard Cornelia E
Bought by
Benard Cornelia E and Galloway Dorothy M
Create a Home Valuation Report for This Property
The Home Valuation Report is an in-depth analysis detailing your home's value as well as a comparison with similar homes in the area
Home Values in the Area
Average Home Value in this Area
Purchase History
| Date | Buyer | Sale Price | Title Company |
|---|---|---|---|
| Galloway Dorothy M | -- | None Available | |
| Galloway Dorothy M | -- | -- | |
| Benard Cornelia E | -- | -- |
Source: Public Records
Tax History
| Year | Tax Paid | Tax Assessment Tax Assessment Total Assessment is a certain percentage of the fair market value that is determined by local assessors to be the total taxable value of land and additions on the property. | Land | Improvement |
|---|---|---|---|---|
| 2025 | $2,351 | $40,699 | $22,066 | $18,633 |
| 2024 | $2,351 | $39,901 | $21,633 | $18,268 |
| 2023 | $2,334 | $39,119 | $21,209 | $17,910 |
| 2022 | $2,196 | $38,351 | $20,793 | $17,558 |
| 2021 | $1,933 | $37,599 | $20,385 | $17,214 |
| 2020 | $1,909 | $37,214 | $20,176 | $17,038 |
| 2019 | $1,733 | $36,485 | $19,781 | $16,704 |
| 2018 | $1,701 | $35,769 | $19,393 | $16,376 |
| 2017 | $1,597 | $35,068 | $19,013 | $16,055 |
| 2016 | $1,445 | $34,380 | $18,640 | $15,740 |
| 2015 | $1,432 | $33,864 | $18,360 | $15,504 |
| 2014 | $1,323 | $33,200 | $18,000 | $15,200 |
Source: Public Records
Map
Nearby Homes
Your Personal Tour Guide
Ask me questions while you tour the home.