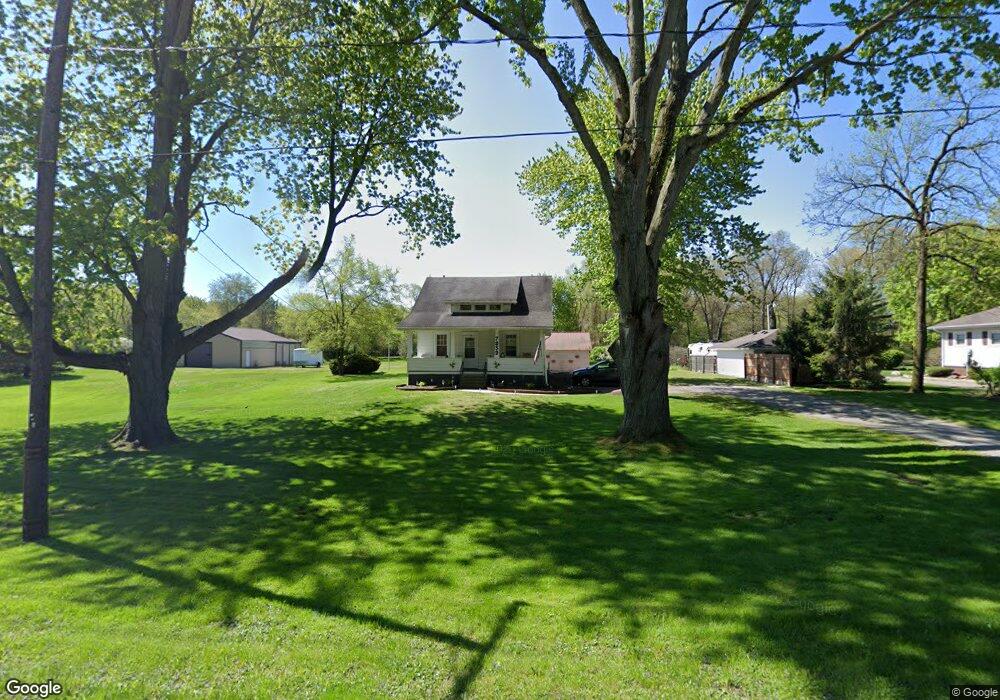
7839 Dorr St Toledo, OH 43617
Estimated Value: $195,000 - $249,000
3
Beds
1
Bath
1,613
Sq Ft
$142/Sq Ft
Est. Value
About This Home
This home is located at 7839 Dorr St, Toledo, OH 43617 and is currently estimated at $229,232, approximately $142 per square foot. 7839 Dorr St is a home located in Lucas County with nearby schools including Dorr Street Elementary School, Springfield Middle School, and Springfield High School.
Ownership History
Date
Name
Owned For
Owner Type
Purchase Details
Closed on
Mar 5, 2020
Sold by
Greater Metropolitan Ttl A Divison Of Fi
Bought by
Freytag Randall W and Freytag Karen A
Current Estimated Value
Purchase Details
Closed on
Nov 19, 2007
Sold by
Freytag Randall W and Freytag Karen A
Bought by
Greater Metropolitan Title Llc
Purchase Details
Closed on
Sep 27, 2005
Sold by
Metropolitan Title Co Ohio Llc
Bought by
Freytag Randall W
Purchase Details
Closed on
Sep 8, 2004
Sold by
Trombla Mark A and Trombla Christine M
Bought by
Metropolitan Title Co Ohio Llc
Purchase Details
Closed on
Apr 22, 1998
Sold by
Damasco Beth A and Kamiski Beth A
Bought by
Trombla Mark A and Trombla Christine M
Home Financials for this Owner
Home Financials are based on the most recent Mortgage that was taken out on this home.
Original Mortgage
$81,600
Interest Rate
7.26%
Purchase Details
Closed on
Jun 27, 1991
Sold by
Steils Susan K
Create a Home Valuation Report for This Property
The Home Valuation Report is an in-depth analysis detailing your home's value as well as a comparison with similar homes in the area
Home Values in the Area
Average Home Value in this Area
Purchase History
| Date | Buyer | Sale Price | Title Company |
|---|---|---|---|
| Freytag Randall W | -- | None Available | |
| Greater Metropolitan Title Llc | -- | Metro | |
| Freytag Randall W | -- | Metro Title Agency Inc | |
| Metropolitan Title Co Ohio Llc | $86,667 | -- | |
| Trombla Mark A | $96,000 | Northwest Title Agency Of Oh | |
| -- | $74,000 | -- |
Source: Public Records
Mortgage History
| Date | Status | Borrower | Loan Amount |
|---|---|---|---|
| Previous Owner | Trombla Mark A | $81,600 |
Source: Public Records
Tax History Compared to Growth
Tax History
| Year | Tax Paid | Tax Assessment Tax Assessment Total Assessment is a certain percentage of the fair market value that is determined by local assessors to be the total taxable value of land and additions on the property. | Land | Improvement |
|---|---|---|---|---|
| 2024 | $2,351 | $63,595 | $13,510 | $50,085 |
| 2023 | $3,711 | $41,335 | $9,555 | $31,780 |
| 2022 | $3,704 | $41,335 | $9,555 | $31,780 |
| 2021 | $3,533 | $41,335 | $9,555 | $31,780 |
| 2020 | $3,307 | $34,370 | $7,910 | $26,460 |
| 2019 | $3,250 | $34,370 | $7,910 | $26,460 |
| 2018 | $3,281 | $34,370 | $7,910 | $26,460 |
| 2017 | $3,329 | $33,110 | $6,545 | $26,565 |
| 2016 | $3,353 | $94,600 | $18,700 | $75,900 |
| 2015 | $3,349 | $94,600 | $18,700 | $75,900 |
| 2014 | $2,295 | $31,850 | $6,300 | $25,550 |
| 2013 | $2,295 | $31,850 | $6,300 | $25,550 |
Source: Public Records
Map
Nearby Homes
- 2015 King Rd
- 8276 Dorr St
- 2143 Fieldbrook Dr
- 2150 Fieldbrook Dr
- 2116 Sunrise Creek Dr
- 1053 Plum Grove Ln
- 1234 Plum Grove Ln
- 7944 Hill Ave
- 2637 Heysler Rd
- 7909 Hill Ave
- 2609 Gradwohl Rd
- 7709 Fountain Dr
- 7111 Nebraska Ave
- 68 Hidden Meadow Dr
- 2606 Wimbledon Park Blvd
- 226 Perrine St
- 126 Hidden Meadow Dr
- 7 Tremore Way
- 2436 Tiffany Village Blvd
- 8740 Dorr St