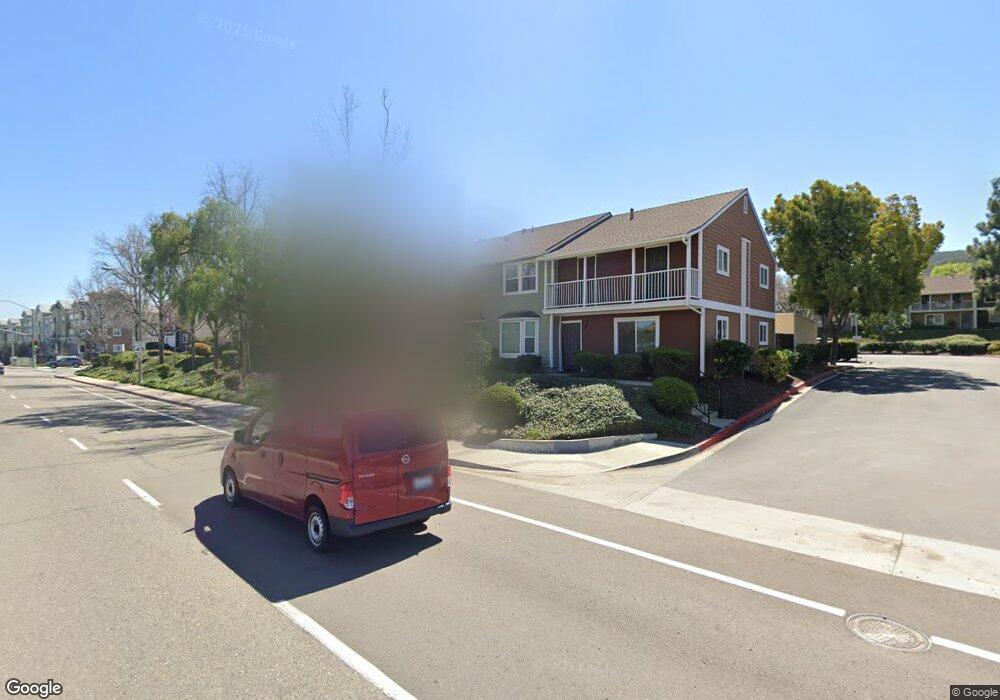
7839 Rancho Fanita Dr Unit C Santee, CA 92071
Estimated Value: $565,000 - $592,384
3
Beds
2
Baths
1,323
Sq Ft
$438/Sq Ft
Est. Value
About This Home
This home is located at 7839 Rancho Fanita Dr Unit C, Santee, CA 92071 and is currently estimated at $579,096, approximately $437 per square foot. 7839 Rancho Fanita Dr Unit C is a home located in San Diego County with nearby schools including Chet F. Harritt Elementary School and West Hills High School.
Ownership History
Date
Name
Owned For
Owner Type
Purchase Details
Closed on
May 14, 2001
Sold by
Henderson Adam T
Bought by
Henderson Adam T
Current Estimated Value
Purchase Details
Closed on
Mar 5, 2001
Sold by
Macdonald Joan and Henderson Leticia
Bought by
Henderson Adam T
Home Financials for this Owner
Home Financials are based on the most recent Mortgage that was taken out on this home.
Original Mortgage
$128,000
Interest Rate
6.42%
Mortgage Type
Purchase Money Mortgage
Purchase Details
Closed on
May 4, 1994
Sold by
Troutman Joan M and Henderson Adam T
Bought by
Troutman Joan T and Henderson Adam T
Home Financials for this Owner
Home Financials are based on the most recent Mortgage that was taken out on this home.
Original Mortgage
$97,200
Interest Rate
3.87%
Mortgage Type
Purchase Money Mortgage
Purchase Details
Closed on
Jul 23, 1987
Create a Home Valuation Report for This Property
The Home Valuation Report is an in-depth analysis detailing your home's value as well as a comparison with similar homes in the area
Home Values in the Area
Average Home Value in this Area
Purchase History
| Date | Buyer | Sale Price | Title Company |
|---|---|---|---|
| Henderson Adam T | -- | -- | |
| Henderson Adam T | -- | -- | |
| Troutman Joan T | -- | Benefit Land Title Company | |
| -- | $77,700 | -- |
Source: Public Records
Mortgage History
| Date | Status | Borrower | Loan Amount |
|---|---|---|---|
| Closed | Henderson Adam T | $128,000 | |
| Closed | Troutman Joan T | $97,200 |
Source: Public Records
Tax History Compared to Growth
Tax History
| Year | Tax Paid | Tax Assessment Tax Assessment Total Assessment is a certain percentage of the fair market value that is determined by local assessors to be the total taxable value of land and additions on the property. | Land | Improvement |
|---|---|---|---|---|
| 2025 | $2,504 | $202,404 | $54,417 | $147,987 |
| 2024 | $2,504 | $198,436 | $53,350 | $145,086 |
| 2023 | $2,428 | $194,546 | $52,304 | $142,242 |
| 2022 | $2,408 | $190,732 | $51,279 | $139,453 |
| 2021 | $2,374 | $186,993 | $50,274 | $136,719 |
| 2020 | $2,345 | $185,077 | $49,759 | $135,318 |
| 2019 | $2,265 | $181,449 | $48,784 | $132,665 |
| 2018 | $2,219 | $177,892 | $47,828 | $130,064 |
| 2017 | $2,190 | $174,405 | $46,891 | $127,514 |
| 2016 | $2,125 | $170,986 | $45,972 | $125,014 |
| 2015 | $2,097 | $168,419 | $45,282 | $123,137 |
| 2014 | $2,056 | $165,120 | $44,395 | $120,725 |
Source: Public Records
Map
Nearby Homes
- 36 Via Sovana Unit 36
- 120 Via Sovana
- 45 Via Sovana Unit 45
- 7883 Rancho Fanita Dr Unit A
- 7893 Rancho Fanita Dr Unit A
- 7824 Cypress Dr
- 19 Carribean Way
- 7711 Jasmine Ct
- 7714 Jasmine Ct
- 8732 Crossway Ct Unit 33
- 8732 Crossway Ct Unit 36
- 7787 Britt Place
- 7908 Rancho Fanita Dr Unit 70
- 7908 Rancho Fanita Dr Unit 23
- 7908 Rancho Fanita Dr Unit 21
- 7908 Rancho Fanita Dr Unit 25
- 7908 Rancho Fanita Spc 4 Dr
- 8069 Mission George Rd Unit 1
- 8339 Carlton Oaks Dr
- 7508 Eagle Dr
- 7819 Rancho Fanita Dr Unit I
- 7819 Rancho Fanita Dr Unit B
- 7827 Rancho Fanita Dr Unit G
- 7827 Rancho Fanita Dr Unit F
- 7827 Rancho Fanita Dr Unit E
- 7827 Rancho Fanita Dr Unit D
- 7827 Rancho Fanita Dr Unit C
- 7827 Rancho Fanita Dr Unit B
- 7827 Rancho Fanita Dr Unit A
- 7823 Rancho Fanita Dr Unit H
- 7823 Rancho Fanita Dr Unit G
- 7823 Rancho Fanita Dr Unit F
- 7823 Rancho Fanita Dr Unit E
- 7823 Rancho Fanita Dr Unit D
- 7823 Rancho Fanita Dr Unit C
- 7823 Rancho Fanita Dr Unit B
- 7823 Rancho Fanita Dr Unit A
- 7839 Rancho Fanita Dr Unit A
- 7839 Rancho Fanita Dr Unit B
- 7839 Rancho Fanita Dr Unit D