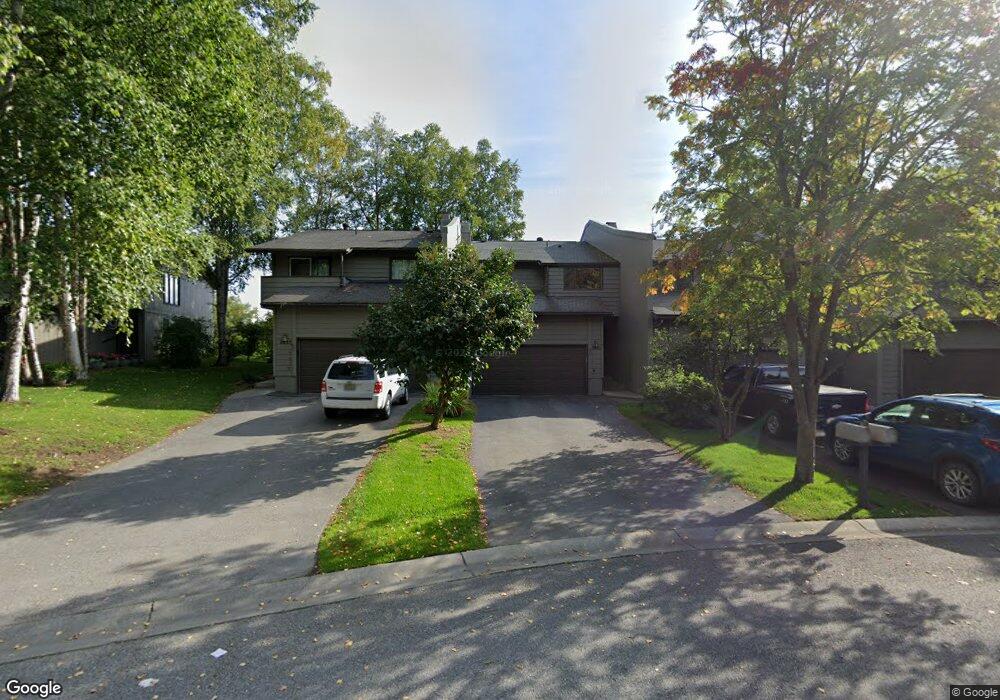
7841 Highlander Dr Anchorage, AK 99518
Taku-Campbell NeighborhoodEstimated Value: $272,000 - $407,000
3
Beds
3
Baths
1,714
Sq Ft
$209/Sq Ft
Est. Value
About This Home
This home is located at 7841 Highlander Dr, Anchorage, AK 99518 and is currently estimated at $358,229, approximately $209 per square foot. 7841 Highlander Dr is a home located in Anchorage Municipality with nearby schools including Campbell Elementary School, Mears Middle School, and Dimond High School.
Ownership History
Date
Name
Owned For
Owner Type
Purchase Details
Closed on
Aug 29, 2007
Sold by
Phillips Joanne M
Bought by
Agha Thanoon J
Current Estimated Value
Home Financials for this Owner
Home Financials are based on the most recent Mortgage that was taken out on this home.
Original Mortgage
$277,173
Outstanding Balance
$173,776
Interest Rate
6.74%
Mortgage Type
VA
Estimated Equity
$184,453
Purchase Details
Closed on
Dec 18, 2006
Sold by
Phillips Joanne M and Maad Joanne M
Bought by
Phillips Joanne M
Home Financials for this Owner
Home Financials are based on the most recent Mortgage that was taken out on this home.
Original Mortgage
$248,675
Interest Rate
6.33%
Mortgage Type
New Conventional
Purchase Details
Closed on
Aug 27, 2003
Sold by
Anderson Arthur B and Anderson Shirley
Bought by
Maad Joanne M
Home Financials for this Owner
Home Financials are based on the most recent Mortgage that was taken out on this home.
Original Mortgage
$163,706
Interest Rate
5.6%
Mortgage Type
FHA
Purchase Details
Closed on
Aug 25, 2003
Sold by
Anderson Arthur B and Anderson Shirley
Bought by
Maad Joanne M
Home Financials for this Owner
Home Financials are based on the most recent Mortgage that was taken out on this home.
Original Mortgage
$163,706
Interest Rate
5.6%
Mortgage Type
FHA
Create a Home Valuation Report for This Property
The Home Valuation Report is an in-depth analysis detailing your home's value as well as a comparison with similar homes in the area
Home Values in the Area
Average Home Value in this Area
Purchase History
| Date | Buyer | Sale Price | Title Company |
|---|---|---|---|
| Agha Thanoon J | -- | Fatic | |
| Phillips Joanne M | -- | United Title Guaranty Agency | |
| Maad Joanne M | -- | -- | |
| Maad Joanne M | -- | First American Title Of Alas |
Source: Public Records
Mortgage History
| Date | Status | Borrower | Loan Amount |
|---|---|---|---|
| Open | Agha Thanoon J | $277,173 | |
| Previous Owner | Phillips Joanne M | $248,675 | |
| Previous Owner | Maad Joanne M | $163,706 | |
| Previous Owner | Maad Joanne M | $163,706 | |
| Closed | Maad Joanne M | $6,548 |
Source: Public Records
Tax History
| Year | Tax Paid | Tax Assessment Tax Assessment Total Assessment is a certain percentage of the fair market value that is determined by local assessors to be the total taxable value of land and additions on the property. | Land | Improvement |
|---|---|---|---|---|
| 2025 | $4,362 | $379,000 | $77,400 | $301,600 |
| 2024 | $4,362 | $345,200 | $77,400 | $267,800 |
| 2023 | $5,525 | $324,400 | $77,400 | $247,000 |
| 2022 | $4,234 | $301,400 | $77,400 | $224,000 |
| 2021 | $5,094 | $282,700 | $77,400 | $205,300 |
| 2020 | $4,150 | $294,400 | $77,400 | $217,000 |
| 2019 | $3,706 | $276,500 | $77,400 | $199,100 |
| 2018 | $3,583 | $268,500 | $56,800 | $211,700 |
| 2017 | $3,924 | $270,600 | $56,800 | $213,800 |
| 2016 | $3,637 | $262,600 | $54,700 | $207,900 |
| 2015 | $3,637 | $254,700 | $54,700 | $200,000 |
| 2014 | $3,637 | $242,900 | $54,700 | $188,200 |
Source: Public Records
Map
Nearby Homes
- 400 W 76th Ave Unit 205
- 400 W 76th Ave Unit 111
- 7560 Foxridge Way Unit C
- 7538 Foxridge Way Unit 8H
- 639 W 75th Ave
- 638 W 74th Ave
- 915 Jayme Ct
- 7321 Huntsmen Cir Unit 21G
- 1028 W 80th Ave
- 1012 W 75th Ave Unit 5
- 000 Arctic Blvd
- 7920 Rovenna St
- 1121 W 77th Ave
- L2 Arctic Blvd
- 501 Nathan Dr Unit 5
- 1153 W 71st Ct
- 374 E 87th Ave
- 7602 Lumbis Ave Unit 1A
- 6901 Cheryl St
- 7000 Chad St
- 7845 Highlander Dr
- 7851 Highlander Dr
- 7833 Highlander Dr
- 7855 Highlander Dr
- 7855 Highlander Dr Unit 3
- 7829 Highlander Dr
- 7864 Highlander Dr
- 7868 Highlander Dr
- 7823 Highlander Dr
- 7854 Highlander Dr
- 7848 Highlander Dr
- 7819 Highlander Dr
- 7878 Highlander Dr
- 7815 Highlander Dr
- 7811 Highlander Dr
- 7871 Highlander Dr
- 7801 Highlander Dr
- 601 Highlander Cir
- 605 Highlander Cir
- 7884 Highlander Dr
Your Personal Tour Guide
Ask me questions while you tour the home.