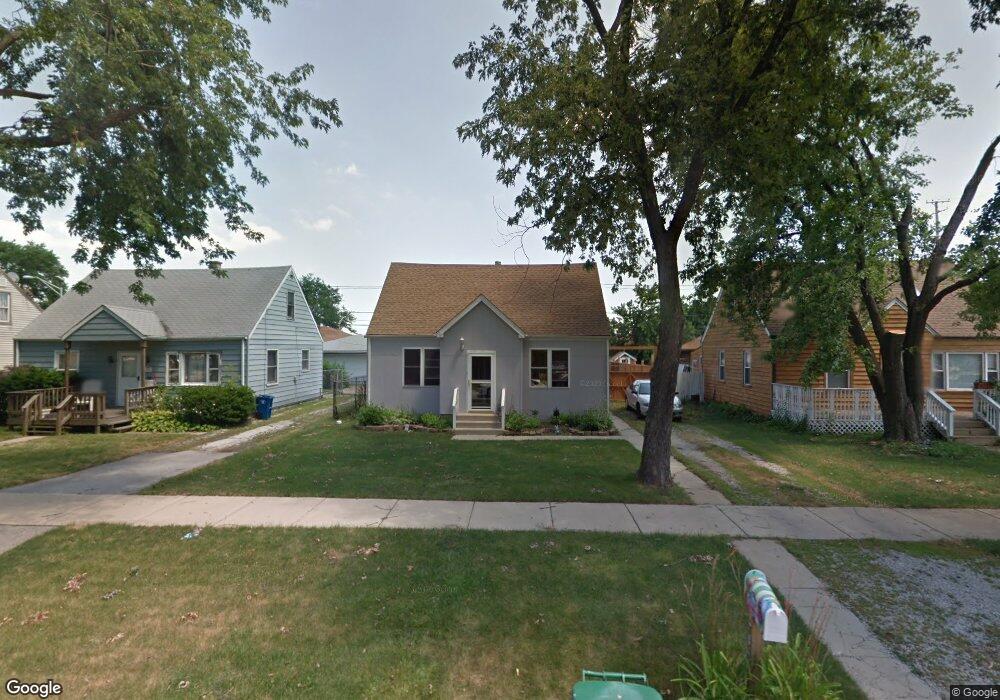
7843 Latrobe Ave Burbank, IL 60459
Estimated Value: $202,000 - $253,423
4
Beds
2
Baths
720
Sq Ft
$315/Sq Ft
Est. Value
About This Home
This home is located at 7843 Latrobe Ave, Burbank, IL 60459 and is currently estimated at $226,856, approximately $315 per square foot. 7843 Latrobe Ave is a home located in Cook County with nearby schools including J.B. Kennedy Elementary School, Reavis High School, and St Albert the Great Catholic School.
Ownership History
Date
Name
Owned For
Owner Type
Purchase Details
Closed on
Apr 9, 2007
Sold by
Martinez Simon and Martinez Dina L
Bought by
Callahan Neil P and Callahan Patty A
Current Estimated Value
Home Financials for this Owner
Home Financials are based on the most recent Mortgage that was taken out on this home.
Original Mortgage
$203,000
Outstanding Balance
$123,009
Interest Rate
6.19%
Mortgage Type
Purchase Money Mortgage
Estimated Equity
$103,847
Purchase Details
Closed on
Jul 19, 2006
Sold by
Martinez Dina L
Bought by
Martinez Simon
Purchase Details
Closed on
Aug 29, 1997
Sold by
Piwowarczyk Zbigniew and Kochanek Jozef
Bought by
Braak Emma E
Home Financials for this Owner
Home Financials are based on the most recent Mortgage that was taken out on this home.
Original Mortgage
$46,000
Interest Rate
7.65%
Purchase Details
Closed on
Dec 16, 1996
Sold by
Kerley Richard Allen and Dineen Shirley R
Bought by
Piwowarczyk Zbigniew and Kochanek Jozef
Create a Home Valuation Report for This Property
The Home Valuation Report is an in-depth analysis detailing your home's value as well as a comparison with similar homes in the area
Home Values in the Area
Average Home Value in this Area
Purchase History
| Date | Buyer | Sale Price | Title Company |
|---|---|---|---|
| Callahan Neil P | $203,000 | Pntn | |
| Martinez Simon | -- | None Available | |
| Braak Emma E | $73,333 | Attorneys Natl Title Network | |
| Piwowarczyk Zbigniew | $60,000 | -- | |
| Dineen Shirley R | -- | Lawyers Title Insurance Corp |
Source: Public Records
Mortgage History
| Date | Status | Borrower | Loan Amount |
|---|---|---|---|
| Open | Callahan Neil P | $203,000 | |
| Previous Owner | Braak Emma E | $46,000 |
Source: Public Records
Tax History Compared to Growth
Tax History
| Year | Tax Paid | Tax Assessment Tax Assessment Total Assessment is a certain percentage of the fair market value that is determined by local assessors to be the total taxable value of land and additions on the property. | Land | Improvement |
|---|---|---|---|---|
| 2024 | $2,176 | $9,002 | $2,993 | $6,009 |
| 2023 | $2,001 | $9,002 | $2,993 | $6,009 |
| 2022 | $2,001 | $7,243 | $2,599 | $4,644 |
| 2021 | $1,935 | $7,241 | $2,598 | $4,643 |
| 2020 | $1,915 | $7,241 | $2,598 | $4,643 |
| 2019 | $1,499 | $6,242 | $2,362 | $3,880 |
| 2018 | $1,455 | $6,242 | $2,362 | $3,880 |
| 2017 | $1,419 | $6,242 | $2,362 | $3,880 |
| 2016 | $1,669 | $6,235 | $1,968 | $4,267 |
| 2015 | $1,581 | $6,235 | $1,968 | $4,267 |
| 2014 | $1,544 | $6,235 | $1,968 | $4,267 |
| 2013 | $1,611 | $6,937 | $1,968 | $4,969 |
Source: Public Records
Map
Nearby Homes
- 5304 W 79th St
- 7814 Leamington Ave
- 7810 S Lockwood Ave
- 5120 W 79th St
- 5116 W 79th St
- 7840 Leclaire Ave
- 7701 Latrobe Ave
- 7927 Lotus Ave
- 5002 W 79th St
- 7714 Lawler Ave
- 7714 Lavergne Ave
- 7657 Lawler Ave
- 7616 S Lorel Ave
- 7707 Linder Ave
- 7650 Lavergne Ave
- 7829 Laporte Ave
- 7832 Lamon Ave
- 5023 W 81st St
- 8026 Linder Ave
- 7519 Latrobe Ave
- 7849 Latrobe Ave
- 7849 Latrobe Ave
- 7843 Latrobe Ave
- 7851 Latrobe Ave
- 7853 Latrobe Ave
- 7859 Latrobe Ave
- 7839 Latrobe Ave
- 7835 Latrobe Ave
- 7848 Laramie Ave
- 7848 Laramie Ave
- 7844 Laramie Ave
- 7844 Laramie Ave
- 7852 Laramie Ave
- 7842 Laramie Ave
- 7842 Laramie Ave
- 7858 Laramie Ave
- 5242 W 79th St Unit 2B
- 5242 W 79th St Unit 3A
- 5242 W 79th St Unit 3C
- 5242 W 79th St Unit 3B