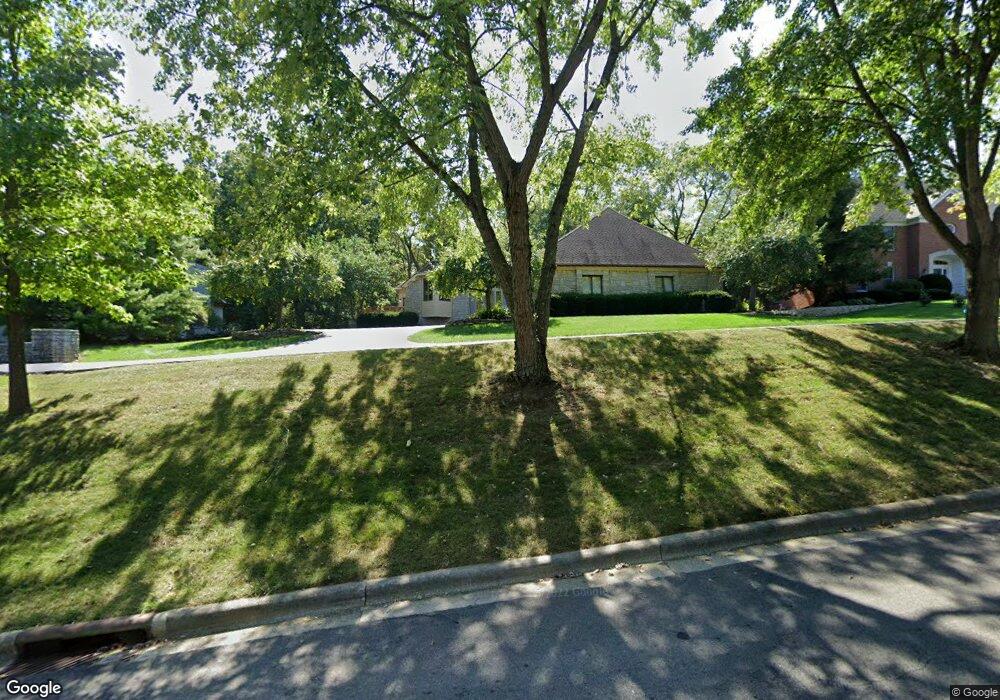
785 Curleys Ct Columbus, OH 43235
Estimated Value: $801,000 - $924,000
5
Beds
4
Baths
5,092
Sq Ft
$166/Sq Ft
Est. Value
About This Home
This home is located at 785 Curleys Ct, Columbus, OH 43235 and is currently estimated at $843,114, approximately $165 per square foot. 785 Curleys Ct is a home located in Franklin County with nearby schools including Bluffsview Elementary School, McCord Middle School, and Worthington Kilbourne High School.
Ownership History
Date
Name
Owned For
Owner Type
Purchase Details
Closed on
May 27, 2009
Sold by
Mahdi Ali Akbar and Samsami Nina
Bought by
Kocak Ergun and Kocak Defne
Current Estimated Value
Home Financials for this Owner
Home Financials are based on the most recent Mortgage that was taken out on this home.
Original Mortgage
$444,950
Interest Rate
5.87%
Mortgage Type
Purchase Money Mortgage
Purchase Details
Closed on
May 23, 1995
Sold by
Pruden Shirley A
Bought by
Samsami Ali Akbar Mahdi and Samsami Nina
Home Financials for this Owner
Home Financials are based on the most recent Mortgage that was taken out on this home.
Original Mortgage
$150,000
Interest Rate
6.25%
Mortgage Type
New Conventional
Purchase Details
Closed on
Aug 24, 1993
Create a Home Valuation Report for This Property
The Home Valuation Report is an in-depth analysis detailing your home's value as well as a comparison with similar homes in the area
Home Values in the Area
Average Home Value in this Area
Purchase History
| Date | Buyer | Sale Price | Title Company |
|---|---|---|---|
| Kocak Ergun | $445,000 | Attorney | |
| Samsami Ali Akbar Mahdi | $260,000 | -- | |
| -- | -- | -- |
Source: Public Records
Mortgage History
| Date | Status | Borrower | Loan Amount |
|---|---|---|---|
| Previous Owner | Kocak Ergun | $444,950 | |
| Previous Owner | Samsami Ali Akbar Mahdi | $150,000 |
Source: Public Records
Tax History Compared to Growth
Tax History
| Year | Tax Paid | Tax Assessment Tax Assessment Total Assessment is a certain percentage of the fair market value that is determined by local assessors to be the total taxable value of land and additions on the property. | Land | Improvement |
|---|---|---|---|---|
| 2024 | $14,576 | $231,670 | $58,560 | $173,110 |
| 2023 | $13,601 | $231,665 | $58,555 | $173,110 |
| 2022 | $17,328 | $234,190 | $42,180 | $192,010 |
| 2021 | $15,986 | $234,190 | $42,180 | $192,010 |
| 2020 | $15,398 | $234,190 | $42,180 | $192,010 |
| 2019 | $14,789 | $202,970 | $36,680 | $166,290 |
| 2018 | $12,476 | $202,970 | $36,680 | $166,290 |
| 2017 | $13,253 | $202,970 | $36,680 | $166,290 |
| 2016 | $11,183 | $157,510 | $29,370 | $128,140 |
| 2015 | $10,905 | $157,510 | $29,370 | $128,140 |
| 2014 | $11,181 | $157,510 | $29,370 | $128,140 |
| 2013 | $6,152 | $174,195 | $26,705 | $147,490 |
Source: Public Records
Map
Nearby Homes
- 1041 Rosebank Dr
- 445 Thackeray Ave
- 6908 Perry Dr
- 7522 Acela St
- 1101 Bluffway Dr
- 1109 Bluffway Dr
- 1232 Lochcarren Ct
- 210 Saint Antoine St Unit 25D
- 1037 Ravine Ridge Dr
- 203 Saint Pierre St
- 7187 Lorine Ct
- 7164 Durness Place
- 1380 Tiehack Ct
- 6577 Plesenton Dr S
- 7347 Fall Creek Ln Unit J
- 6105 Flora Villa Dr
- 130 W Clearview Ave
- 1620 Park Row Dr Unit A
- 2687 Snouffer Rd
- 1672 Rushing Way
- 801 Curleys Ct
- 769 Curleys Ct
- 817 Curleys Ct
- 810 Curleys Ct
- 0 Curleys Ct Unit L 14 9716840
- 0 Curleys Ct
- 794 Curleys Ct
- 878 Curley's Ct
- 826 Curleys Ct
- 833 Curleys Ct
- 842 Curleys Ct
- 849 Curleys Ct
- 6889 Olentangy River Rd
- 1824 Snouffer Rd
- 1828 Snouffer Rd
- 1800 Snouffer Rd
- 865 Curleys Ct
- 854 Curleys Ct
- 1820 Snouffer Rd
- 787 Maple Hill Blvd