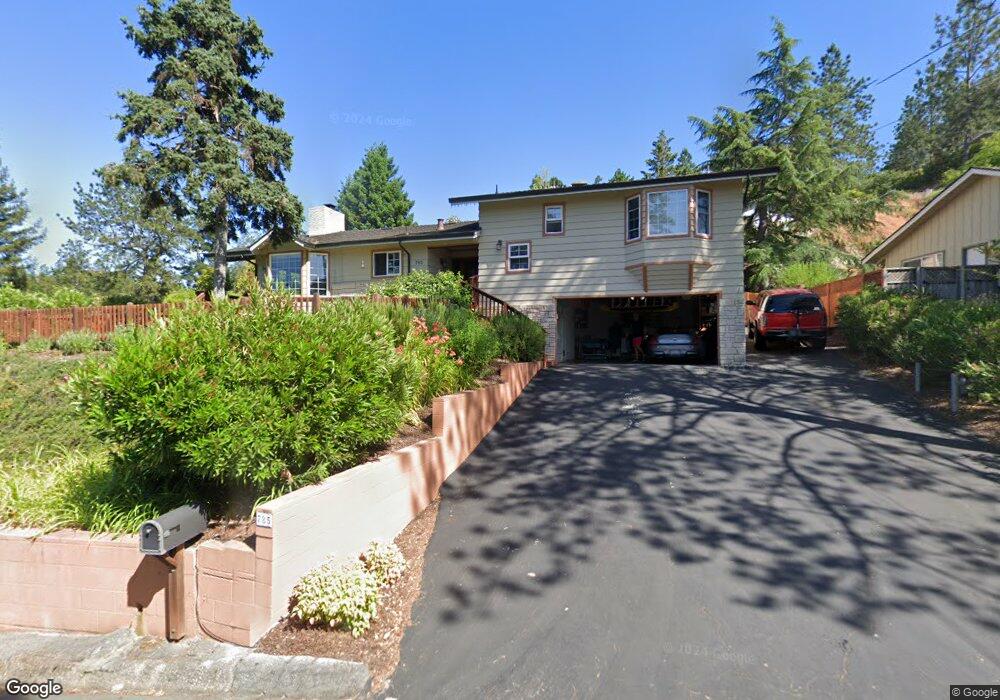
785 Pinecone Dr Scotts Valley, CA 95066
Estimated Value: $1,269,260 - $1,554,000
3
Beds
3
Baths
1,978
Sq Ft
$710/Sq Ft
Est. Value
About This Home
This home is located at 785 Pinecone Dr, Scotts Valley, CA 95066 and is currently estimated at $1,403,565, approximately $709 per square foot. 785 Pinecone Dr is a home located in Santa Cruz County with nearby schools including Brook Knoll Elementary School, Scotts Valley Middle School, and Scotts Valley High School.
Ownership History
Date
Name
Owned For
Owner Type
Purchase Details
Closed on
Dec 9, 2021
Sold by
Shoemate Roger A and Shoemate Debra A
Bought by
Shoemate Roger A and Shoemate Debra A
Current Estimated Value
Purchase Details
Closed on
Jul 23, 1997
Sold by
Snider John E and Bargetto Snider Rita
Bought by
Shoemate Roger A and Shoemate Debra A
Home Financials for this Owner
Home Financials are based on the most recent Mortgage that was taken out on this home.
Original Mortgage
$292,500
Outstanding Balance
$42,213
Interest Rate
7.58%
Estimated Equity
$1,361,352
Purchase Details
Closed on
Nov 10, 1994
Sold by
Jackson Milford M and Jackson Dale M
Bought by
Snider John E and Bargetto Snider Rita
Home Financials for this Owner
Home Financials are based on the most recent Mortgage that was taken out on this home.
Original Mortgage
$223,200
Interest Rate
8.75%
Create a Home Valuation Report for This Property
The Home Valuation Report is an in-depth analysis detailing your home's value as well as a comparison with similar homes in the area
Home Values in the Area
Average Home Value in this Area
Purchase History
| Date | Buyer | Sale Price | Title Company |
|---|---|---|---|
| Shoemate Roger A | -- | None Available | |
| Shoemate Roger A | $390,000 | First American Title Ins Co | |
| Snider John E | -- | Old Republic Title Company | |
| Snider John E | $279,500 | Old Republic Title Company | |
| Jackson Dale M | -- | Old Republic Title Company |
Source: Public Records
Mortgage History
| Date | Status | Borrower | Loan Amount |
|---|---|---|---|
| Open | Shoemate Roger A | $292,500 | |
| Previous Owner | Snider John E | $223,200 |
Source: Public Records
Tax History
| Year | Tax Paid | Tax Assessment Tax Assessment Total Assessment is a certain percentage of the fair market value that is determined by local assessors to be the total taxable value of land and additions on the property. | Land | Improvement |
|---|---|---|---|---|
| 2025 | $7,648 | $622,746 | $373,647 | $249,099 |
| 2023 | $7,442 | $598,564 | $359,138 | $239,426 |
| 2022 | $7,281 | $586,827 | $352,096 | $234,731 |
| 2021 | $7,120 | $575,321 | $345,192 | $230,129 |
| 2020 | $7,022 | $569,422 | $341,653 | $227,769 |
| 2019 | $6,927 | $558,256 | $334,953 | $223,303 |
| 2018 | $6,528 | $547,311 | $328,386 | $218,925 |
| 2017 | $6,435 | $536,579 | $321,948 | $214,631 |
| 2016 | $6,147 | $526,058 | $315,635 | $210,423 |
| 2015 | $6,154 | $518,156 | $310,894 | $207,262 |
| 2014 | $5,902 | $508,006 | $304,804 | $203,202 |
Source: Public Records
Map
Nearby Homes
- 361 Collado Dr
- 601 Lassen Park Ct
- 444 Whispering Pines Dr Unit 79
- 107 Arabian Way
- 125 Arabian Way
- 225 Mt Hermon Rd Unit 165
- 225 Mount Hermon Rd Unit 217
- 140 Silverwood Dr
- 918 Lundy Ln
- 111 Ponderosa Dr
- 111 Bean Creek Rd Unit 156
- 111 Bean Creek Rd Unit 158
- 311 Bean Creek Rd Unit 305
- 192 Bean Creek Rd
- Lot 08 Madrone Ave
- 146 Bean Creek Rd Unit D3
- 115 Christel Oaks Dr Unit A
- 340 Cress Rd
- 515 Lockhart Gulch Rd
- 43 and 44 Buckeye Ln
- 799 Pinecone Dr
- 783 Pinecone Dr
- 120 Alto Sol Ct
- 122 Alto Sol Ct
- 780 Pinecone Dr
- 821 Pinecone Dr
- 804 Pinecone Dr
- 770 Pinecone Dr
- 781 Pinecone Dr
- 145 Loma Linda Ct
- 118 Alto Sol Ct
- 760 Pinecone Dr
- 820 Pinecone Dr
- 833 Pinecone Dr
- 750 Pinecone Dr
- 740 Pinecone Dr
- 140 Loma Linda Ct
- 104 Baja Sol Dr
- 106 Baja Sol Dr
- 159 Alto Sol Ct
Your Personal Tour Guide
Ask me questions while you tour the home.