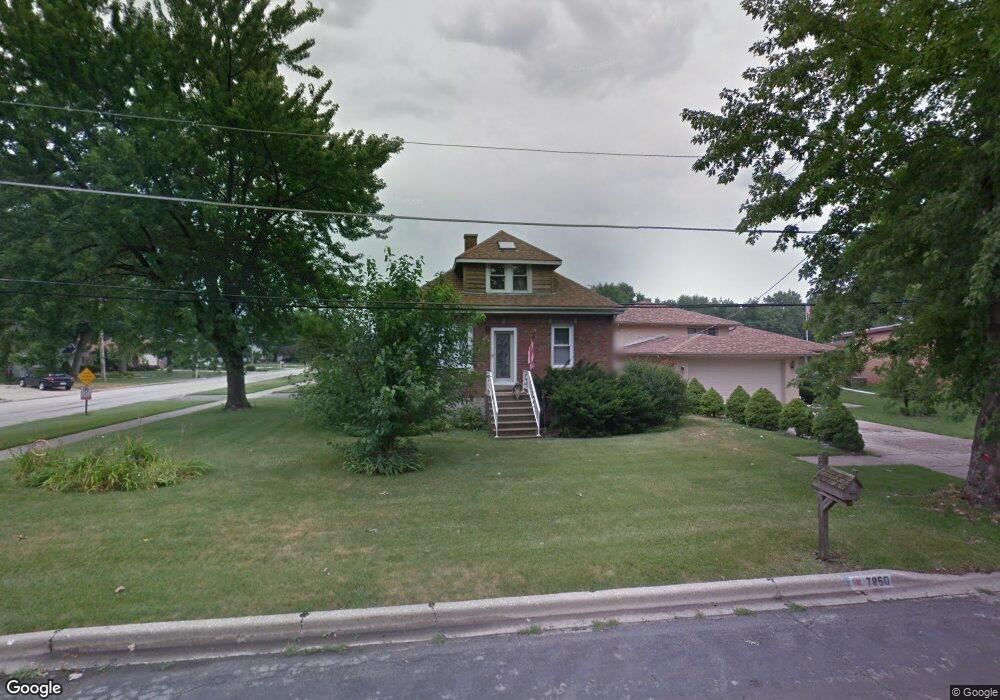
7850 W 73rd St Bridgeview, IL 60455
Estimated Value: $186,000 - $332,000
2
Beds
1
Bath
780
Sq Ft
$341/Sq Ft
Est. Value
About This Home
This home is located at 7850 W 73rd St, Bridgeview, IL 60455 and is currently estimated at $265,657, approximately $340 per square foot. 7850 W 73rd St is a home located in Cook County with nearby schools including Robina Lyle Elementary and Argo Community High School.
Ownership History
Date
Name
Owned For
Owner Type
Purchase Details
Closed on
Oct 31, 2016
Sold by
Walsh Thomas W
Bought by
Walsh Diane M
Current Estimated Value
Home Financials for this Owner
Home Financials are based on the most recent Mortgage that was taken out on this home.
Original Mortgage
$110,235
Outstanding Balance
$10,554
Interest Rate
3.12%
Mortgage Type
New Conventional
Estimated Equity
$255,103
Purchase Details
Closed on
Mar 2, 1999
Sold by
Macku Jennifer and Macku Mark R
Bought by
Weber Diane and Walsh Thomas
Home Financials for this Owner
Home Financials are based on the most recent Mortgage that was taken out on this home.
Original Mortgage
$121,900
Interest Rate
11%
Purchase Details
Closed on
Dec 22, 1998
Sold by
Standard Bank & Trust Co Hickory Hills
Bought by
Macku Jennifer
Home Financials for this Owner
Home Financials are based on the most recent Mortgage that was taken out on this home.
Original Mortgage
$75,000
Interest Rate
6.83%
Create a Home Valuation Report for This Property
The Home Valuation Report is an in-depth analysis detailing your home's value as well as a comparison with similar homes in the area
Home Values in the Area
Average Home Value in this Area
Purchase History
| Date | Buyer | Sale Price | Title Company |
|---|---|---|---|
| Walsh Diane M | -- | Ravenswood Title Company Llc | |
| Weber Diane | $135,500 | -- | |
| Macku Jennifer | -- | -- |
Source: Public Records
Mortgage History
| Date | Status | Borrower | Loan Amount |
|---|---|---|---|
| Open | Walsh Diane M | $110,235 | |
| Closed | Weber Diane | $121,900 | |
| Previous Owner | Macku Jennifer | $75,000 |
Source: Public Records
Tax History
| Year | Tax Paid | Tax Assessment Tax Assessment Total Assessment is a certain percentage of the fair market value that is determined by local assessors to be the total taxable value of land and additions on the property. | Land | Improvement |
|---|---|---|---|---|
| 2025 | $7,137 | $17,920 | $3,926 | $13,994 |
| 2024 | $7,137 | $17,920 | $3,926 | $13,994 |
| 2023 | $4,243 | $24,000 | $3,926 | $20,074 |
| 2022 | $4,243 | $14,037 | $3,490 | $10,547 |
| 2021 | $4,127 | $14,035 | $3,489 | $10,546 |
| 2020 | $4,082 | $14,035 | $3,489 | $10,546 |
| 2019 | $3,402 | $11,684 | $3,271 | $8,413 |
| 2018 | $3,249 | $11,684 | $3,271 | $8,413 |
| 2017 | $3,207 | $11,684 | $3,271 | $8,413 |
| 2016 | $3,515 | $11,080 | $2,835 | $8,245 |
| 2015 | $4,297 | $11,080 | $2,835 | $8,245 |
| 2014 | $4,154 | $11,080 | $2,835 | $8,245 |
| 2013 | $4,828 | $14,161 | $2,835 | $11,326 |
Source: Public Records
Map
Nearby Homes
- 7838 W 73rd Place
- 7912 W 73rd St
- 7214 S 78th Ave
- 7945 W 73rd Place
- 7948 74th St
- 7957 W 73rd Place
- 7929 W 74th St
- 7616 S 78th Ave
- 7506 S Ferdinand Ave
- 7332 Beloit Ave
- 6918 Garden Ln
- 7416 Thomas Ave
- 7727 S Roberts Rd
- 7545 Beloit Ave
- 7705 Columbia Dr
- 6807 S 79th Ave
- 7851 Suburban Ln
- 7420 Maple Dr Unit 547420
- 7216 S Octavia Ave
- 7303 W 75th St
- 7846 W 73rd St
- 7840 W 73rd St
- 7244 Sholer Ave
- 7301 Sholer Ave
- 7240 Sholer Ave
- 7820 W 73rd St
- 7906 W 73rd St
- 7230 Sholer Ave
- 7843 W 73rd St
- 7307 Sholer Ave
- 7901 W 73rd St
- 7818 W 73rd St
- 7837 W 73rd St
- 7224 Sholer Ave
- 7907 W 73rd St
- 7315 Sholer Ave
- 7831 W 73rd St
- 7231 Stickney Ave
- 7816 W 73rd St
- 7220 Sholer Ave
Your Personal Tour Guide
Ask me questions while you tour the home.