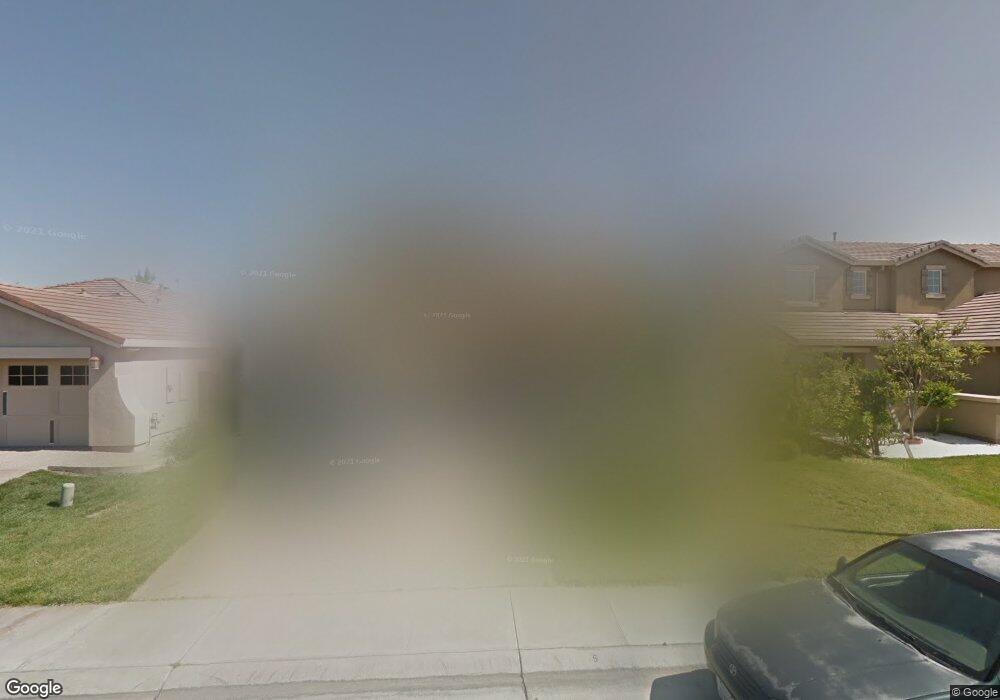
7851 Black Sand Way Antelope, CA 95843
Estimated Value: $500,000 - $679,000
5
Beds
3
Baths
2,554
Sq Ft
$243/Sq Ft
Est. Value
About This Home
This home is located at 7851 Black Sand Way, Antelope, CA 95843 and is currently estimated at $621,439, approximately $243 per square foot. 7851 Black Sand Way is a home located in Sacramento County with nearby schools including Barrett Ranch Elementary School, Antelope Crossing Middle School, and Antelope High School.
Ownership History
Date
Name
Owned For
Owner Type
Purchase Details
Closed on
Sep 23, 2017
Sold by
Moua Chertong and Moua Cher
Bought by
Moua Chertong
Current Estimated Value
Home Financials for this Owner
Home Financials are based on the most recent Mortgage that was taken out on this home.
Original Mortgage
$25,000
Outstanding Balance
$20,871
Interest Rate
3.89%
Mortgage Type
Credit Line Revolving
Estimated Equity
$600,568
Purchase Details
Closed on
Jul 21, 2006
Sold by
Lennar Renaissance Inc
Bought by
Moua Cher
Home Financials for this Owner
Home Financials are based on the most recent Mortgage that was taken out on this home.
Original Mortgage
$381,050
Outstanding Balance
$219,532
Interest Rate
6.12%
Mortgage Type
Purchase Money Mortgage
Estimated Equity
$401,907
Purchase Details
Closed on
Jan 10, 2006
Sold by
Mw Housing Partners Iii Lp
Bought by
Lennar Renaissance Inc
Create a Home Valuation Report for This Property
The Home Valuation Report is an in-depth analysis detailing your home's value as well as a comparison with similar homes in the area
Home Values in the Area
Average Home Value in this Area
Purchase History
| Date | Buyer | Sale Price | Title Company |
|---|---|---|---|
| Moua Chertong | -- | Placer Title Company | |
| Moua Cher | $476,500 | North American Title Co | |
| Lennar Renaissance Inc | -- | North American Title Company |
Source: Public Records
Mortgage History
| Date | Status | Borrower | Loan Amount |
|---|---|---|---|
| Open | Moua Chertong | $25,000 | |
| Open | Moua Cher | $381,050 |
Source: Public Records
Tax History Compared to Growth
Tax History
| Year | Tax Paid | Tax Assessment Tax Assessment Total Assessment is a certain percentage of the fair market value that is determined by local assessors to be the total taxable value of land and additions on the property. | Land | Improvement |
|---|---|---|---|---|
| 2025 | $7,726 | $638,213 | $214,358 | $423,855 |
| 2024 | $7,726 | $625,700 | $210,155 | $415,545 |
| 2023 | $7,626 | $613,433 | $206,035 | $407,398 |
| 2022 | $7,610 | $601,406 | $201,996 | $399,410 |
| 2021 | $7,259 | $558,666 | $187,642 | $371,024 |
| 2020 | $6,486 | $492,218 | $165,324 | $326,894 |
| 2019 | $6,280 | $473,288 | $158,966 | $314,322 |
| 2018 | $5,993 | $459,503 | $154,336 | $305,167 |
| 2017 | $5,606 | $429,443 | $144,240 | $285,203 |
| 2016 | $5,096 | $386,886 | $129,946 | $256,940 |
| 2015 | $4,788 | $361,576 | $121,445 | $240,131 |
| 2014 | $4,656 | $347,669 | $116,774 | $230,895 |
Source: Public Records
Map
Nearby Homes
- 7929 Eagle Peak Way
- 7926 Eagle Peak Way
- 7628 Laguna Beach Way
- 8038 Falcon View Dr
- 8008 Landmark Place
- 8136 Chimango Way
- 7531 Event Way
- 7631 Conklin Ct
- 7761 Megan Ann Way
- 7665 Copper Cove Place
- 7813 Megan Ann Ct
- 8210 Rambleton Way
- 4937 Cherryville Ln
- 4923 Falconwood Ct
- 7340 Hamden Place Unit 104
- 8020 Walerga Rd Unit 1061
- 8020 Walerga Rd Unit 3
- 7329 Monogram Dr
- 4840 Dover Ln Unit 405
- 4840 Dover Ln Unit 406
- 7855 Black Sand Way
- 7847 Black Sand Way
- 7859 Black Sand Way
- 7843 Black Sand Way
- 7821 Ocean Park Dr
- 7812 La Piedra Place
- 7863 Black Sand Way
- 7839 Black Sand Way
- 7817 Ocean Park Dr
- 7808 La Piedra Place
- 7867 Black Sand Way
- 7835 Black Sand Way
- 7813 Ocean Park Dr
- 7813 La Piedra Place
- 7804 La Piedra Place
- 7831 Black Sand Way
- 7809 Ocean Park Dr
- 7809 La Piedra Place
- 7800 La Piedra Place
- 7827 Black Sand Way