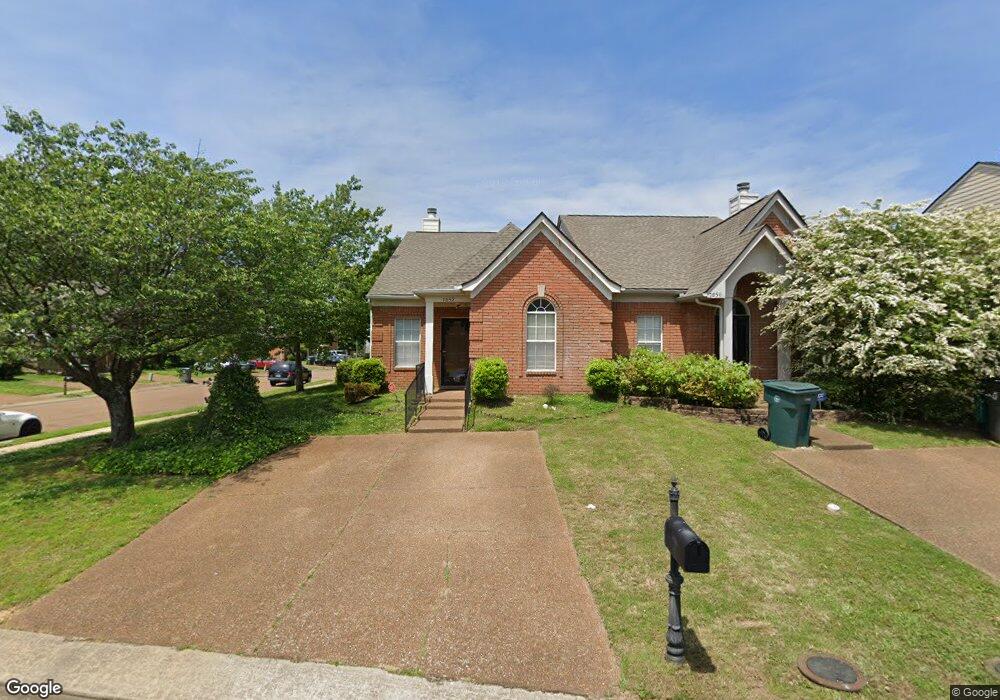
7852 Brady Creek Cove Cordova, TN 38016
Cordova NeighborhoodEstimated Value: $149,000 - $176,000
2
Beds
2
Baths
1,080
Sq Ft
$154/Sq Ft
Est. Value
About This Home
This home is located at 7852 Brady Creek Cove, Cordova, TN 38016 and is currently estimated at $165,866, approximately $153 per square foot. 7852 Brady Creek Cove is a home located in Shelby County with nearby schools including Cordova Elementary School, Cordova Middle School, and Cordova High School.
Ownership History
Date
Name
Owned For
Owner Type
Purchase Details
Closed on
Aug 22, 2022
Sold by
Salvo Wilson Joanne
Bought by
Young Joyce
Current Estimated Value
Home Financials for this Owner
Home Financials are based on the most recent Mortgage that was taken out on this home.
Original Mortgage
$163,000
Outstanding Balance
$155,572
Interest Rate
5.3%
Mortgage Type
VA
Estimated Equity
$10,294
Purchase Details
Closed on
Apr 4, 2015
Sold by
Palase Lillie Mariesalo
Bought by
Wilson Joanne Salvo
Purchase Details
Closed on
Mar 19, 2015
Sold by
Salvo Alfonso Virgil
Bought by
Wilson Joanne Salvo
Purchase Details
Closed on
Jan 28, 1997
Sold by
Lenox Homes Llc
Bought by
Salvo Janie M
Home Financials for this Owner
Home Financials are based on the most recent Mortgage that was taken out on this home.
Original Mortgage
$41,820
Interest Rate
7.77%
Mortgage Type
FHA
Create a Home Valuation Report for This Property
The Home Valuation Report is an in-depth analysis detailing your home's value as well as a comparison with similar homes in the area
Home Values in the Area
Average Home Value in this Area
Purchase History
| Date | Buyer | Sale Price | Title Company |
|---|---|---|---|
| Young Joyce | $163,000 | Tri State Title & Escrow | |
| Wilson Joanne Salvo | -- | None Available | |
| Wilson Joanne Salvo | -- | None Available | |
| Salvo Janie M | $79,000 | Southern Escrow Title Compan |
Source: Public Records
Mortgage History
| Date | Status | Borrower | Loan Amount |
|---|---|---|---|
| Open | Young Joyce | $163,000 | |
| Previous Owner | Salvo Janie M | $41,820 |
Source: Public Records
Tax History Compared to Growth
Tax History
| Year | Tax Paid | Tax Assessment Tax Assessment Total Assessment is a certain percentage of the fair market value that is determined by local assessors to be the total taxable value of land and additions on the property. | Land | Improvement |
|---|---|---|---|---|
| 2025 | $1,048 | $39,325 | $8,450 | $30,875 |
| 2024 | $1,048 | $30,900 | $4,500 | $26,400 |
| 2023 | $1,882 | $30,900 | $4,500 | $26,400 |
| 2022 | $1,882 | $30,900 | $4,500 | $26,400 |
| 2021 | $1,066 | $30,900 | $4,500 | $26,400 |
| 2020 | $1,413 | $19,500 | $4,500 | $15,000 |
| 2019 | $623 | $19,500 | $4,500 | $15,000 |
| 2018 | $623 | $19,500 | $4,500 | $15,000 |
| 2017 | $638 | $19,500 | $4,500 | $15,000 |
| 2016 | $792 | $18,125 | $0 | $0 |
| 2014 | $792 | $18,125 | $0 | $0 |
Source: Public Records
Map
Nearby Homes
- 1289 Brady Hollow Ln
- 7875 Brady Creek Cove
- 1130 Hunters Green Cir S
- 1115 Hunters Green Cir S
- 7801 Autumn Creek Dr
- 1102 Trappers Cove
- 1311 Fox Trace Dr
- 7893 Bentwood Cir
- 1220 Palmina Cove
- 7659 Cordova Club Dr E
- 7952 Meadow Trail Dr
- 1012 Hunters Point Dr
- 7730 Ivy Mist Cove W
- 7565 Wintergreen Ln
- 7776 Grey Squirrel Cove
- 1268 Winter Springs Ln
- 7999 Club Center Dr
- 984 Spinnaker Ln
- 7779 Killdeer Ln
- 1475 Killdeer Cove
- 7856 Brady Creek Cove
- 7860 Brady Creek Cove
- 1222 Brady Hollow Ln
- 7864 Brady Creek Cove
- 1230 Brady Hollow Ln
- 1213 Brady Hollow Ln
- 1209 Brady Hollow Ln
- 1217 Brady Hollow Ln
- 7870 Brady Creek Cove
- 1205 Brady Hollow Ln
- 1225 Brady Hollow Ln
- 7874 Brady Creek Cove
- 1201 Brady Hollow Ln
- 1250 Brady Hollow Ln
- 1229 Brady Hollow Ln
- 7855 Brady Creek Cove
- 7863 Brady Creek Cove
- 7859 Brady Creek Cove
- 7878 Brady Creek Cove
- 1197 Brady Hollow Ln