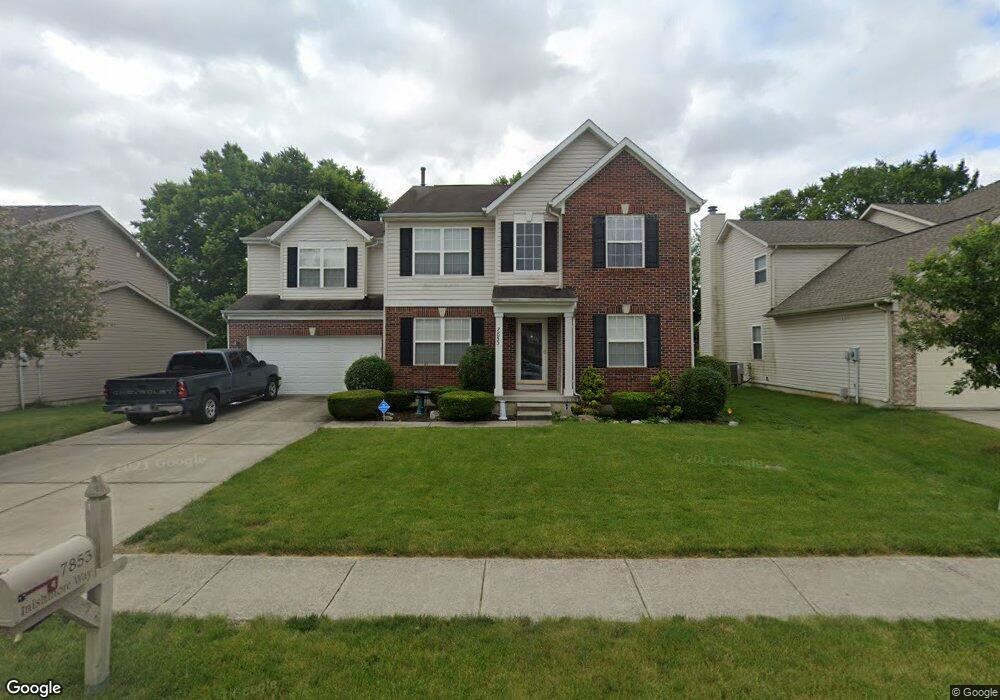
7853 Inishmore Way Unit 3 Indianapolis, IN 46214
Key Meadows NeighborhoodEstimated Value: $332,000 - $394,000
4
Beds
3
Baths
3,392
Sq Ft
$106/Sq Ft
Est. Value
About This Home
This home is located at 7853 Inishmore Way Unit 3, Indianapolis, IN 46214 and is currently estimated at $358,249, approximately $105 per square foot. 7853 Inishmore Way Unit 3 is a home located in Marion County with nearby schools including Robey Elementary School, Chapel Hill 7th & 8th Grade Center, and Ben Davis Ninth Grade Center.
Ownership History
Date
Name
Owned For
Owner Type
Purchase Details
Closed on
Feb 9, 2024
Sold by
Hylton Anna Marie R
Bought by
Finney Marvin Gaye
Current Estimated Value
Home Financials for this Owner
Home Financials are based on the most recent Mortgage that was taken out on this home.
Original Mortgage
$325,600
Outstanding Balance
$319,846
Interest Rate
6.61%
Mortgage Type
FHA
Estimated Equity
$38,403
Purchase Details
Closed on
Sep 23, 2011
Sold by
Vernon Goldman Nicole M and Goldman Burnell L
Bought by
Hylton Anna Marie R
Home Financials for this Owner
Home Financials are based on the most recent Mortgage that was taken out on this home.
Original Mortgage
$167,639
Interest Rate
4.4%
Mortgage Type
FHA
Purchase Details
Closed on
Feb 20, 2007
Sold by
Sandala Michael K and Synder Sandala Melissa J
Bought by
Goldman Burnell L and Vernon Goldman Nicole M
Home Financials for this Owner
Home Financials are based on the most recent Mortgage that was taken out on this home.
Original Mortgage
$117,650
Interest Rate
6.27%
Mortgage Type
New Conventional
Create a Home Valuation Report for This Property
The Home Valuation Report is an in-depth analysis detailing your home's value as well as a comparison with similar homes in the area
Home Values in the Area
Average Home Value in this Area
Purchase History
| Date | Buyer | Sale Price | Title Company |
|---|---|---|---|
| Finney Marvin Gaye | -- | None Listed On Document | |
| Hylton Anna Marie R | -- | None Available | |
| Goldman Burnell L | -- | None Available |
Source: Public Records
Mortgage History
| Date | Status | Borrower | Loan Amount |
|---|---|---|---|
| Open | Finney Marvin Gaye | $325,600 | |
| Previous Owner | Hylton Anna Marie R | $167,639 | |
| Previous Owner | Goldman Burnell L | $117,650 |
Source: Public Records
Tax History Compared to Growth
Tax History
| Year | Tax Paid | Tax Assessment Tax Assessment Total Assessment is a certain percentage of the fair market value that is determined by local assessors to be the total taxable value of land and additions on the property. | Land | Improvement |
|---|---|---|---|---|
| 2024 | $3,449 | $335,100 | $26,300 | $308,800 |
| 2023 | $3,449 | $286,100 | $26,300 | $259,800 |
| 2022 | $3,328 | $273,300 | $26,300 | $247,000 |
| 2021 | $3,077 | $221,200 | $26,300 | $194,900 |
| 2020 | $2,946 | $212,300 | $26,300 | $186,000 |
| 2019 | $2,803 | $202,600 | $26,300 | $176,300 |
| 2018 | $2,282 | $188,700 | $26,300 | $162,400 |
| 2017 | $2,277 | $188,400 | $26,300 | $162,100 |
| 2016 | $2,279 | $188,700 | $26,300 | $162,400 |
| 2014 | $1,692 | $169,200 | $26,300 | $142,900 |
| 2013 | $1,529 | $157,600 | $26,300 | $131,300 |
Source: Public Records
Map
Nearby Homes
- 7906 Inishmore Dr
- 2463 Kettering Way
- 7957 Midlothian Way
- 8116 W Carlow Cir
- 2999 Eagles Crest Cir Unit A
- 8333 Pine Branch Ln
- 7659 Eagle Valley Pass
- 2990 Horse Hill East Dr
- 2821 Mission Hills Ln
- 8615 Longspur Ct
- 8655 Longspur Ct
- 8615 Sunningdale Blvd
- 3131 Stillmeadow Dr
- 8109 Valley Farms Trail
- 3025 Scottsdale Dr
- 6932 Lohr Way
- 8419 Brook Pointe Ct
- 7009 Thousand Oaks Ln
- 8001 Valley Farms Ln
- 7045 Buick Dr
- 7853 Inishmore Way
- 7859 Inishmore Way
- 7847 Inishmore Way
- 2336 Historic Oaks Blvd
- 2332 Historic Oaks Blvd
- 2342 Historic Oaks Blvd
- 7903 Inishmore Way
- 7841 Inishmore Way
- 2343 Rolling Oak Dr
- 7854 Inishmore Way
- 7860 Inishmore Way
- 7909 Inishmore Way
- 2328 Historic Oaks Blvd
- 7904 Inishmore Way
- 2337 Rolling Oak Dr
- 7835 Inishmore Way
- 2285 Leith Ct
- 7912 Inishmore Way
- 2331 Rolling Oak Dr
- 2324 Historic Oaks Blvd