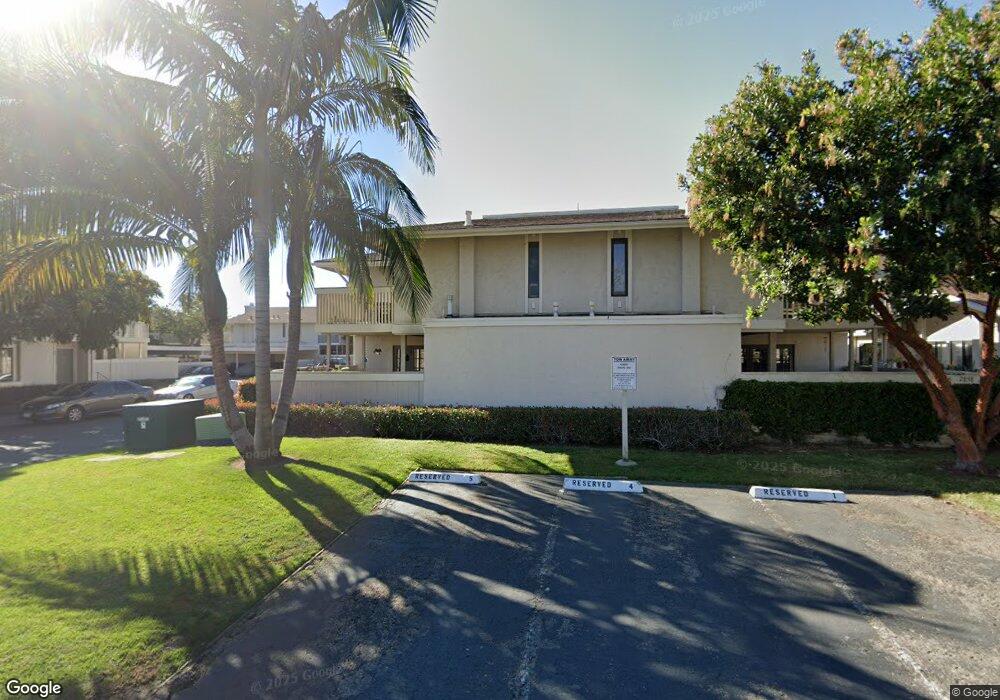
7854 Camino Aguila Unit 7854 San Diego, CA 92122
University City NeighborhoodEstimated Value: $912,000 - $1,110,000
3
Beds
3
Baths
1,380
Sq Ft
$698/Sq Ft
Est. Value
About This Home
This home is located at 7854 Camino Aguila Unit 7854, San Diego, CA 92122 and is currently estimated at $962,914, approximately $697 per square foot. 7854 Camino Aguila Unit 7854 is a home located in San Diego County with nearby schools including Doyle Elementary School, Standley Middle School, and University City High School.
Ownership History
Date
Name
Owned For
Owner Type
Purchase Details
Closed on
May 21, 2020
Sold by
Zhang Chen and Xu Xiaojun
Bought by
Zhang Chen and Xu Xiaojun
Current Estimated Value
Home Financials for this Owner
Home Financials are based on the most recent Mortgage that was taken out on this home.
Original Mortgage
$320,000
Outstanding Balance
$280,829
Interest Rate
2.8%
Mortgage Type
New Conventional
Estimated Equity
$682,085
Purchase Details
Closed on
Dec 30, 2015
Sold by
Riley Carole J and Pagel Carole J
Bought by
Zhang Chen and Xu Xiaojun
Home Financials for this Owner
Home Financials are based on the most recent Mortgage that was taken out on this home.
Original Mortgage
$347,250
Interest Rate
3.92%
Mortgage Type
New Conventional
Purchase Details
Closed on
Aug 8, 2008
Sold by
Riley Michael E
Bought by
Riley Carole J and Pagel Carole J
Create a Home Valuation Report for This Property
The Home Valuation Report is an in-depth analysis detailing your home's value as well as a comparison with similar homes in the area
Home Values in the Area
Average Home Value in this Area
Purchase History
| Date | Buyer | Sale Price | Title Company |
|---|---|---|---|
| Zhang Chen | -- | First American Title Ins Co | |
| Zhang Chen | $463,000 | First American Title Ins Co | |
| Riley Carole J | -- | None Available |
Source: Public Records
Mortgage History
| Date | Status | Borrower | Loan Amount |
|---|---|---|---|
| Open | Zhang Chen | $320,000 | |
| Closed | Zhang Chen | $347,250 |
Source: Public Records
Tax History Compared to Growth
Tax History
| Year | Tax Paid | Tax Assessment Tax Assessment Total Assessment is a certain percentage of the fair market value that is determined by local assessors to be the total taxable value of land and additions on the property. | Land | Improvement |
|---|---|---|---|---|
| 2025 | $6,631 | $548,088 | $146,052 | $402,036 |
| 2024 | $6,631 | $537,342 | $143,189 | $394,153 |
| 2023 | $6,485 | $526,807 | $140,382 | $386,425 |
| 2022 | $6,313 | $516,479 | $137,630 | $378,849 |
| 2021 | $6,270 | $506,353 | $134,932 | $371,421 |
| 2020 | $6,108 | $501,162 | $133,549 | $367,613 |
| 2019 | $5,997 | $491,336 | $130,931 | $360,405 |
| 2018 | $5,606 | $481,703 | $128,364 | $353,339 |
| 2017 | $81 | $472,259 | $125,848 | $346,411 |
| 2016 | $2,649 | $223,194 | $59,477 | $163,717 |
| 2015 | $2,610 | $219,842 | $58,584 | $161,258 |
| 2014 | $2,570 | $215,537 | $57,437 | $158,100 |
Source: Public Records
Map
Nearby Homes
- 7825 Camino Tranquilo Unit 26
- 7837 Camino Tranquilo
- 3965 Camino Lindo Unit 194
- 3941 Camino Lindo
- 7969 Caminito Dia Unit 3
- 7975 Playmor Terrace
- 4145 Porte de Merano Unit 128
- 4210 Porte de Palmas Unit 28
- 7849 Camino Glorita
- 7833 Camino Huerta
- 8308 Regents Rd Unit 1F
- 8308 Regents Rd Unit 1H
- 7986 Camino Jonata
- 8338 Regents Rd Unit 1S
- 8328 Regents Rd Unit 1K
- 8090 Camino Kiosco
- 7565 Charmant Dr Unit 615
- 7565 Charmant Dr Unit 512
- 7597 Charmant Dr Unit 901
- 7915 Camino Kiosco
- 7854 Camino Aguila
- 7852 Camino Aguila Unit 5
- 7856 Camino Aguila
- 7858 Camino Aguila
- 7868 Camino Aguila
- 7862 Camino Aguila
- 7866 Camino Aguila
- 7864 Camino Aguila
- 3963 Camino Calma
- 3961 Camino Calma
- 3965 Camino Calma Unit 70
- 3967 Camino Calma
- 3944 Camino Calma
- 3942 Camino Calma
- 3946 Camino Calma Unit 16
- 3948 Camino Calma
- 3956 Camino Calma
- 3954 Camino Calma Unit 11
- 3958 Camino Calma
- 7857 Camino Aguila