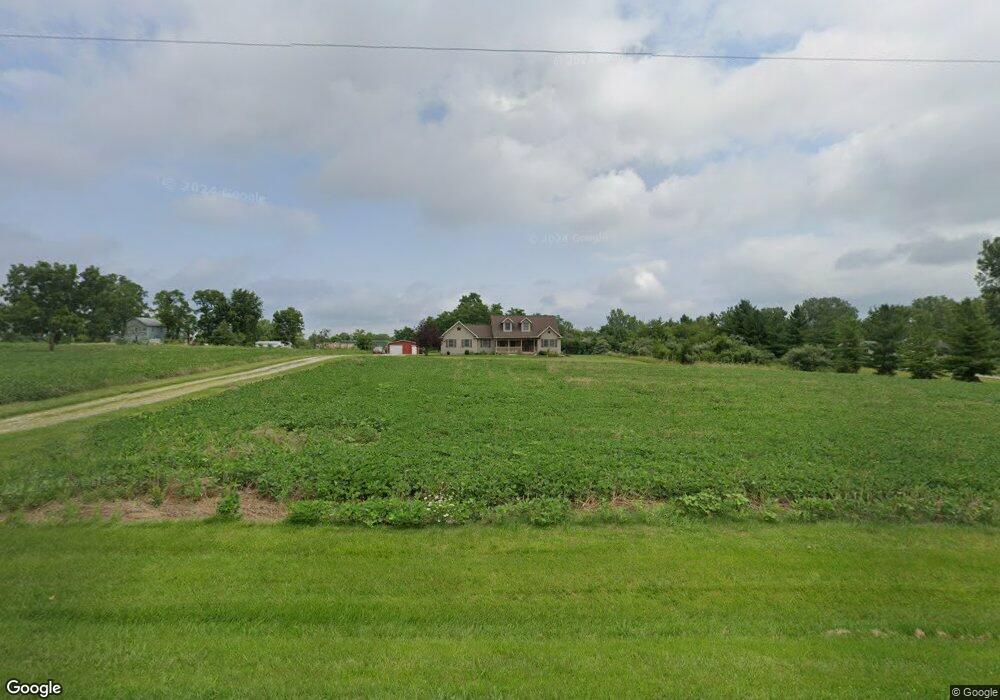
7855 W Piqua Clayton Rd Covington, OH 45318
Estimated Value: $166,000 - $206,205
2
Beds
1
Bath
1,678
Sq Ft
$114/Sq Ft
Est. Value
About This Home
This home is located at 7855 W Piqua Clayton Rd, Covington, OH 45318 and is currently estimated at $190,551, approximately $113 per square foot. 7855 W Piqua Clayton Rd is a home located in Miami County with nearby schools including Covington Elementary/Junior High School, Covington Junior High School, and Covington High School.
Ownership History
Date
Name
Owned For
Owner Type
Purchase Details
Closed on
Jul 31, 2015
Sold by
Trochelman John E
Bought by
Bauer Chad T and Bauer Nicole
Current Estimated Value
Home Financials for this Owner
Home Financials are based on the most recent Mortgage that was taken out on this home.
Original Mortgage
$89,900
Outstanding Balance
$70,826
Interest Rate
4.08%
Mortgage Type
VA
Estimated Equity
$119,725
Purchase Details
Closed on
Nov 13, 2001
Sold by
Lambroff Darryl and Lambroff Leo Lora
Bought by
Lambroff Darryl
Home Financials for this Owner
Home Financials are based on the most recent Mortgage that was taken out on this home.
Original Mortgage
$33,000
Interest Rate
6.72%
Purchase Details
Closed on
Jun 22, 1993
Sold by
Lambroff Lora Aleo
Bought by
Gasserman Helen
Create a Home Valuation Report for This Property
The Home Valuation Report is an in-depth analysis detailing your home's value as well as a comparison with similar homes in the area
Home Values in the Area
Average Home Value in this Area
Purchase History
| Date | Buyer | Sale Price | Title Company |
|---|---|---|---|
| Bauer Chad T | $89,900 | First Ohio Title Insurance | |
| Lambroff Darryl | $53,000 | -- | |
| Gasserman Helen | -- | -- |
Source: Public Records
Mortgage History
| Date | Status | Borrower | Loan Amount |
|---|---|---|---|
| Open | Bauer Chad T | $89,900 | |
| Closed | Lambroff Darryl | $33,000 |
Source: Public Records
Tax History Compared to Growth
Tax History
| Year | Tax Paid | Tax Assessment Tax Assessment Total Assessment is a certain percentage of the fair market value that is determined by local assessors to be the total taxable value of land and additions on the property. | Land | Improvement |
|---|---|---|---|---|
| 2024 | $1,479 | $44,140 | $14,980 | $29,160 |
| 2023 | $1,479 | $44,140 | $14,980 | $29,160 |
| 2022 | $1,498 | $44,140 | $14,980 | $29,160 |
| 2021 | $1,303 | $33,960 | $11,520 | $22,440 |
| 2020 | $1,237 | $33,960 | $11,520 | $22,440 |
| 2019 | $1,233 | $33,960 | $11,520 | $22,440 |
| 2018 | $1,003 | $28,070 | $10,080 | $17,990 |
| 2017 | $1,023 | $28,070 | $10,080 | $17,990 |
| 2016 | $982 | $28,070 | $10,080 | $17,990 |
| 2015 | $202 | $14,390 | $9,520 | $4,870 |
| 2014 | $202 | $14,390 | $9,520 | $4,870 |
| 2013 | $511 | $14,390 | $9,520 | $4,870 |
Source: Public Records
Map
Nearby Homes
- 7648 Piqua-Clayton Rd
- 731 N Pearl St
- 520 N Pearl St
- 501 N Main St Unit C1
- 698 E Broadway St
- 6110 Ohio 185
- 271 N Ludlow St
- 133 W Broadway St
- 124 N Main St
- 00 W Piqua Clay Rd
- 223 Henry Ct
- 221 S High St
- 9145 W US Route 36
- 536 S High St
- 5882 W Versailles Rd
- 5225 N Front St
- 8341 W Covington Gettysburg Rd
- 210 Charles Ct
- 206 Charles Ct
- 204 Charles Ct
- 7733 N Crescent Rd
- 7865 W Piqua Clayton Rd
- 7775 W Piqua Clayton Rd
- 7860 W Piqua Clayton Rd
- 7860 Piqua Clay
- 7750 W Piqua Clayton Rd
- 7685 W Piqua Clayton Rd
- 7730 N Crescent Rd
- 7690 N Crescent Rd
- 7650 N Crescent Rd
- 7575 N State Route 48
- 7648 W Piqua Clayton Rd
- 7790 N Crescent Rd
- 7575 Ohio 48
- 0 N Crescent Rd Unit 1705794
- 0 N Crescent Rd Unit Lot 3 1705794
- 0 N Crescent Rd Unit Lot 2 1705793
- 0 N Crescent Rd Unit Lot 2 843308
- 0 N Crescent Rd Unit Lot 3 843305
- 0 N Crescent Rd